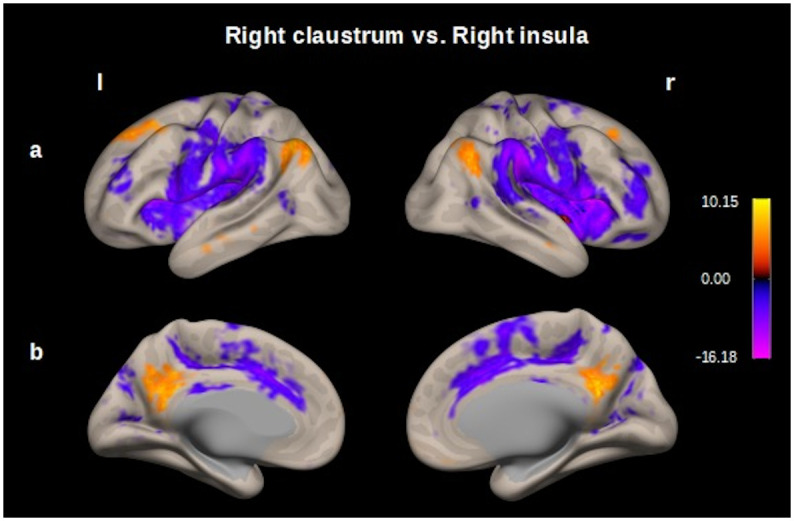
Fig 7. Map of the resting-state functional connectivity right claustrum vs. right insula.

Seed–voxel analysis thresholded at p < 0.001 followed by p<0.05, p-FDR correction; entire sample 100 subjects. Row (A) Left and right, opercular cortex, prefrontal cortex, precentral and postcentral gyrus (functional connectivity for insula in cold colors), prefrontal cortex and posterior parietal cortex (functional connectivity for claustrum in hot colors). B) Left and right, cingulate cortex and precuneous. These functional connectivity maps were estimated using the CONN toolbox (V18b, Functional connectivity toolbox, NITRC) [46].
