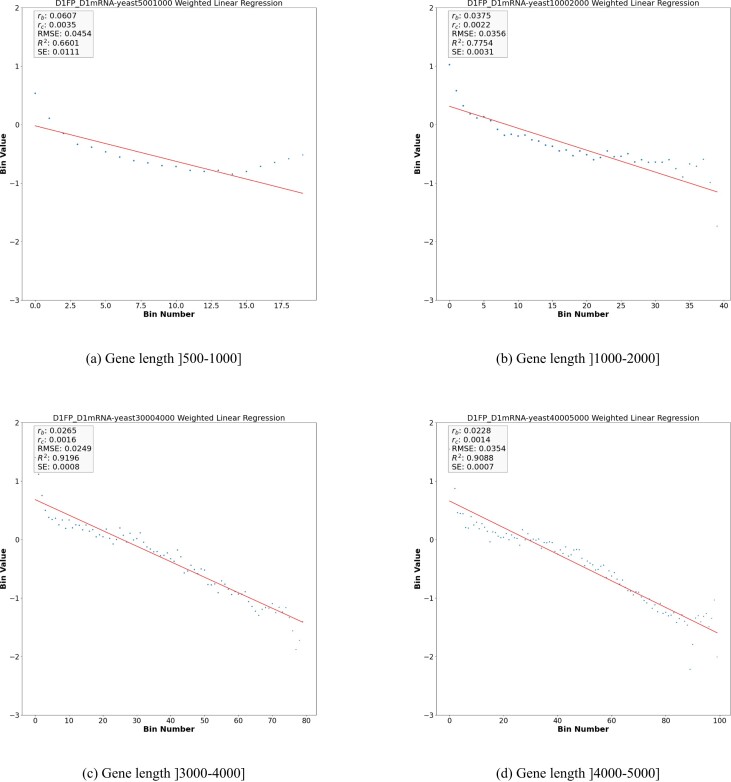
Figure 3.
Weighted linear regression plot using bin-size equals 50 for the Y vector for the control dataset D1 (synthetic defined) using different gene length cutoffs. (see Equation 6 in supplementary material). The x-axis is the bin number and the y-axis is the Y vector in Log exponential. The red line corresponds to the drop-off rate rb.

