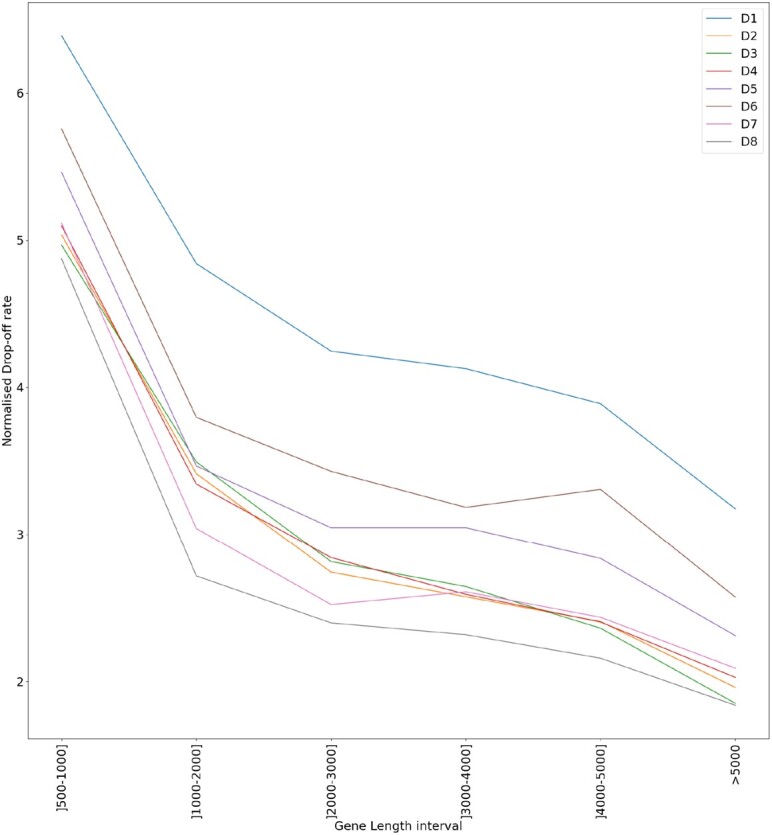
Figure 4.

Drop-off rate per bin (rb) for each gene length subset group. The different colours represent the different analysed datasets. The values of rb are standardised to facilitate the visualisation. The subset [0–500] is removed from this plot because the associated values of rb turned out to be not significantly different from zero.
