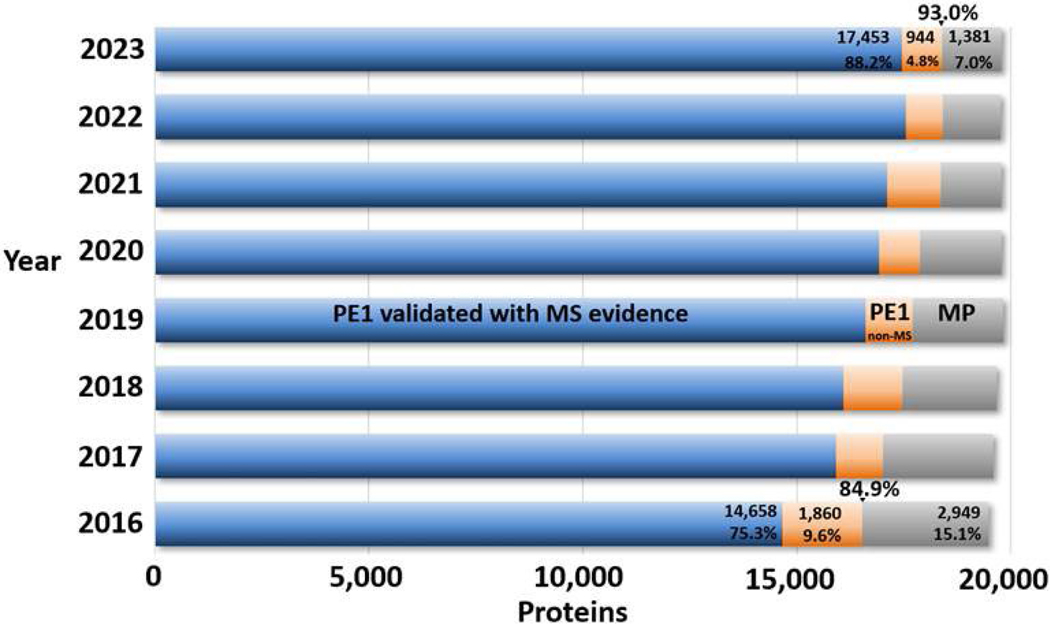
Figure 1.
This bar chart documents progress in reducing PE2,3,4 missing proteins (gray) and increasing PE1 proteins (blue + orange). Within the PE1 proteins, there is a shift from non-MS PE1 proteins (orange) to MS-based PE1 proteins (blue). The base year is 2016, after the introduction of the much more stringent HPP Mass Spectrometry Data Interpretation Guidelines v2.1.

