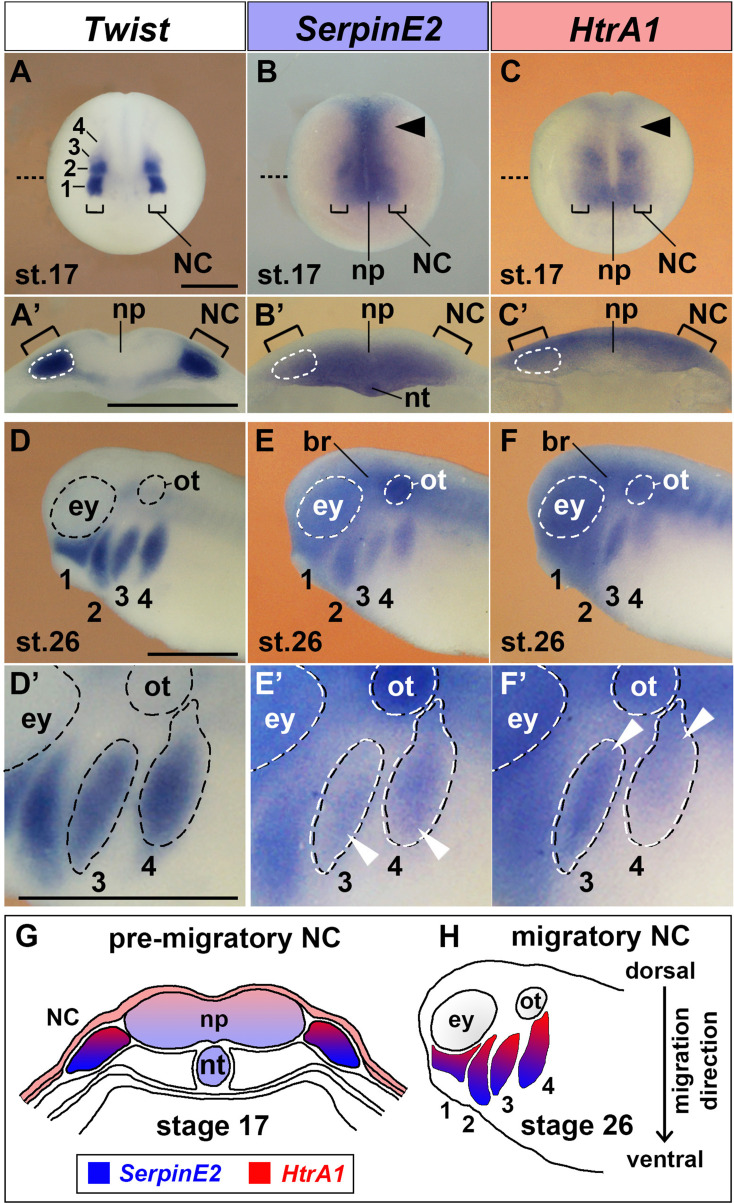
Figure 1. SerpinE2 and HtrA1 are expressed in the neural crest.
Xenopus embryos were analyzed by whole-mount in situ hybridization. (A–C) Anterior view of embryos at stage 17. The brackets point to pre-migratory NC cells on each side of the neural plate. The numbers label the Twist-expressing cranial NC segments: 1, mandibular; 2, hyoid; 3, anterior branchial; 4, posterior branchial. Arrowheads show SerpinE2 and HtrA1 transcripts in the trunk NC. The stippled lines indicate the level of sections in A’–C’. (A’–C’) Transversally hemisectioned embryos. SerpinE2 and HtrA1 signals appear in the NC (strippled circle lines). Note that SerpinE2 is also expressed in the inner sensorial layer of the neural plate and underlying notochord, whereas HtrA1 expression is more abundant in the outer ependymal layer of the neural plate. (D–F) Lateral view of embryos at stage 26. SerpinE2 and HtrA1 are expressed in Twist+ NC cell streams (1–4). Transcripts of both genes can also be seen in the brain, eye, and otic placode. (D’–F’) Magnification of embryos. Arrowheads demarcate SerpinE2 transcripts near the front (E’) and HtrA1 transcripts at the rear end (F’) of the migrating NC cell collectives in the branchial arches. (G, H) Summary of gene expression domains. At stage 17, SerpinE2 is transcribed in ventral and HtrA1 in dorsal cells of the pre-migratory NC (G). At stage 26, SerpinE2 is expressed in leader cells and HtrA1 in follower cells of migrating NC streams (H).br, brain; ey, eye; NC, neural crest; np, neural plate; nt, notochord; ot, otic placode. Scale bars, 0.5 mm.


