. 2024 Apr 18;12:RP91864. doi: 10.7554/eLife.91864

Figure 4. HtrA1 overexpression and SerpinE2 knockdown decrease cartilaginous elements and craniofacial structures.

Xenopus embryos were injected into four animal blastomeres at the eight-cell stage with a total of 100 pg mRNA and 40 ng morpholino oligonucleotides (MOs). (A–D’) Tadpoles at stages 40/41 after whole-mount in situ hybridization in lateral (A–D) and ventral view (A’–D’). Note that HtrA1 mRNA and SerpinE2-MO reduce Sox9 expression, whereas control-MO has no effect on the labeled cartilaginous elements. (E–K) Ventral view of cartilaginous skeleton extracted from embryos at stage 46 after Alcian Blue staining. The dorsal ethmoid-trabecular cartilage was removed for better visibility. Note that HtrA1 mRNA, but not HtrA1(S307A) and Flag-HtrA1ΔSP mRNAs, diminishes craniofacial structures (E–H). SerpinE2-MO, but not control-MO nor a combination of SerpinE2-MO and Flag-SerpinE2 mRNA, reduce head skeleton structures (I–K). (L) Scheme of the cartilaginous skeleton at stage 46 in ventral view. Indicated is the contribution of neural crest streams to the craniofacial skeleton elements. cb, ceratobranchial; ch, ceratohyal; et, ethmoid-trabecular; mc, Meckel’s cartilage; pq, palatoquadrate. Indicated phenotypes were shown in A, 11/11; B, 17/19; C, 12/13; D, 15/17; E, 57/58; F, 17/21; G, 72/77; H, 67/78; I, 83/88; J, 73/77; K, 77/87 embryos; at least two independent experiments. Scale bars, 0.5mm.

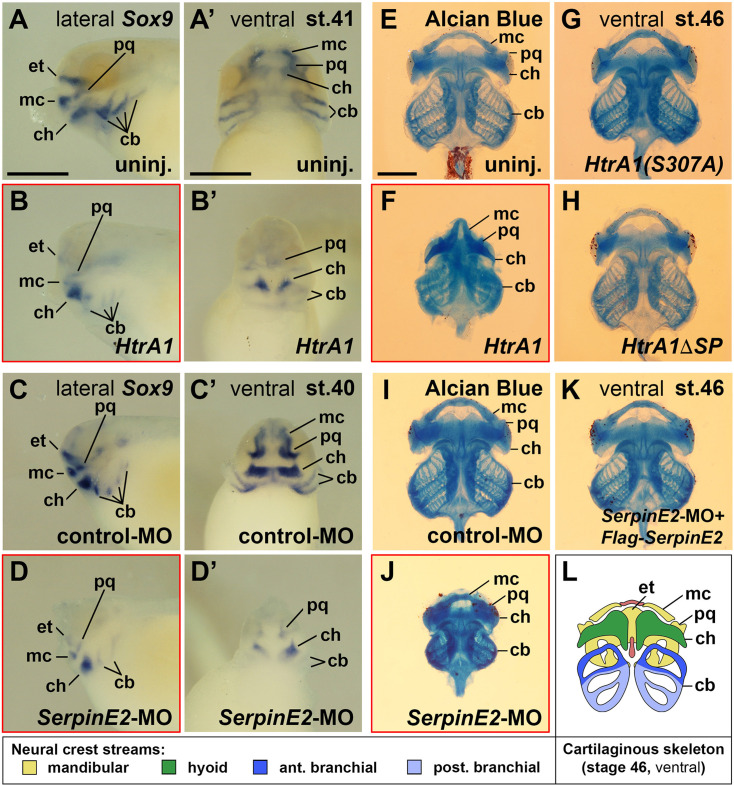
Figure 4.

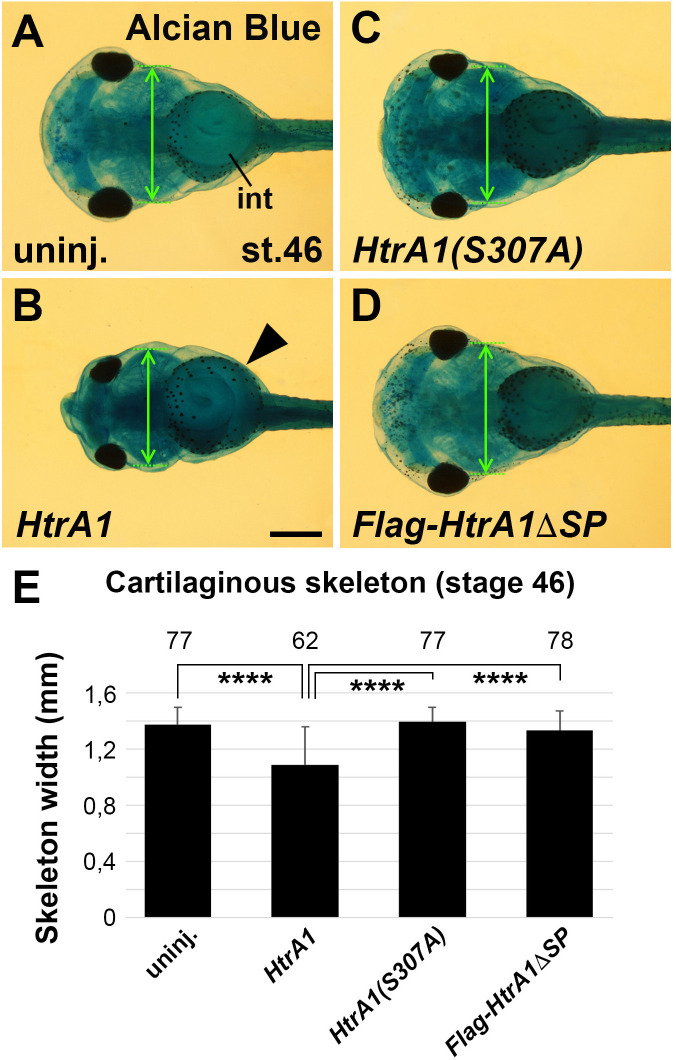
Figure 4—figure supplement 1. Overexpression of HtrA1 decreases cartilaginous elements and craniofacial structures.

Figure 4—figure supplement 1.

Embryos were injected into four animal blastomeres at the eight-cell stage with a total of 100 pg mRNA. (A–D) Ventral view of embryos at stage 46 after Alcian Blue staining. Note that HtrA1 mRNA decreases the skeleton width (double arrow at the level of the ceratobranchial cartilage structures) but does not affect gut coiling (arrowhead). HtrA1(S307A) and HtrA1ΔSP mRNAs have no effects. (E) Quantification of the skeleton width. The number of analyzed specimen is indicated above each column. int, intestine. Indicated phenotypes were shown in A, 73/74; B, 58/62; C, 73/77; D, 67/78 embryos. Scale bar, 0.5mm. Data in all graphs are displayed as mean ± SD, n ≥ 2; ****p<0.0001, one-way ANOVA followed by Tukey’s post hoc test.
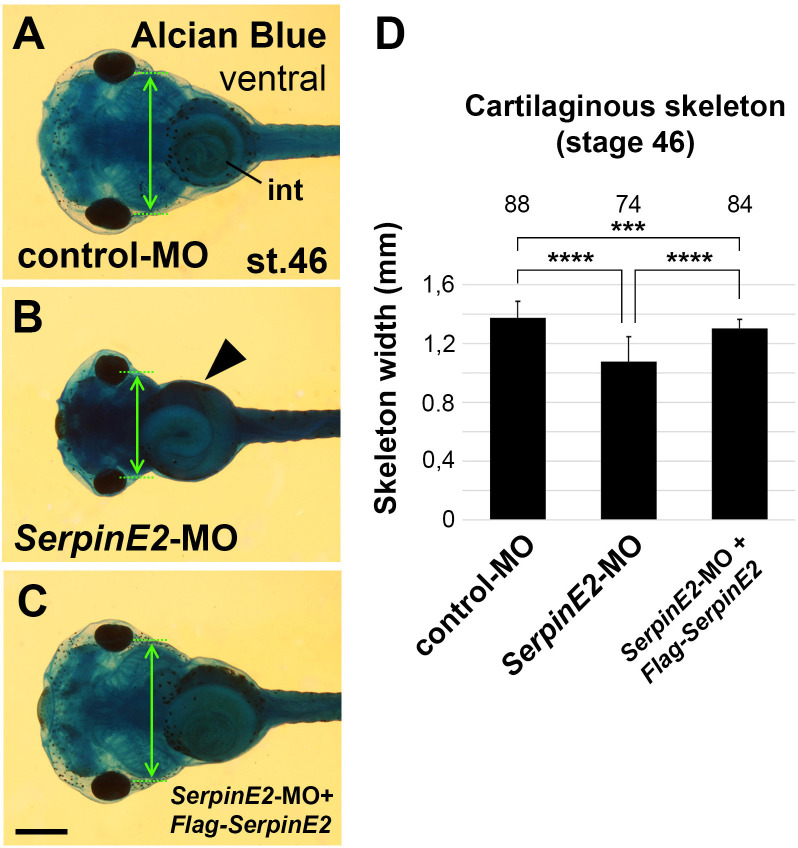
Figure 4—figure supplement 2. Knockdown of SerpinE2 reduces craniofacial skeleton formation.

Figure 4—figure supplement 2.

Morpholino oligonucleotides (MOs) were injected into Xenopus embryos at the eight-cell stage. (A–C) Ventral view of tadpoles at stage 46 after Alcian Blue staining. Note that SerpinE2-MO decreases the branchial skeleton width (double arrow) but does not affect gut coiling (arrowhead). The control-MO and a combination of SerpinE2-MO and Flag-SerpinE2 mRNA have no effects. (D) Quantification of the skeleton width. The number of analyzed specimen is indicated above each column. Embryos were injected into four animal blastomeres with a total of 40 ng MO. int, intestine. Indicated phenotypes were shown in A, 76/88; B, 72/74; C, 78/85. Scale bar, 0.5mm. Data in all graphs are displayed as mean ± SD, n ≥ 3; ***p<0.001, ****p<0.0001, one-way ANOVA followed by Tukey’s post hoc test.