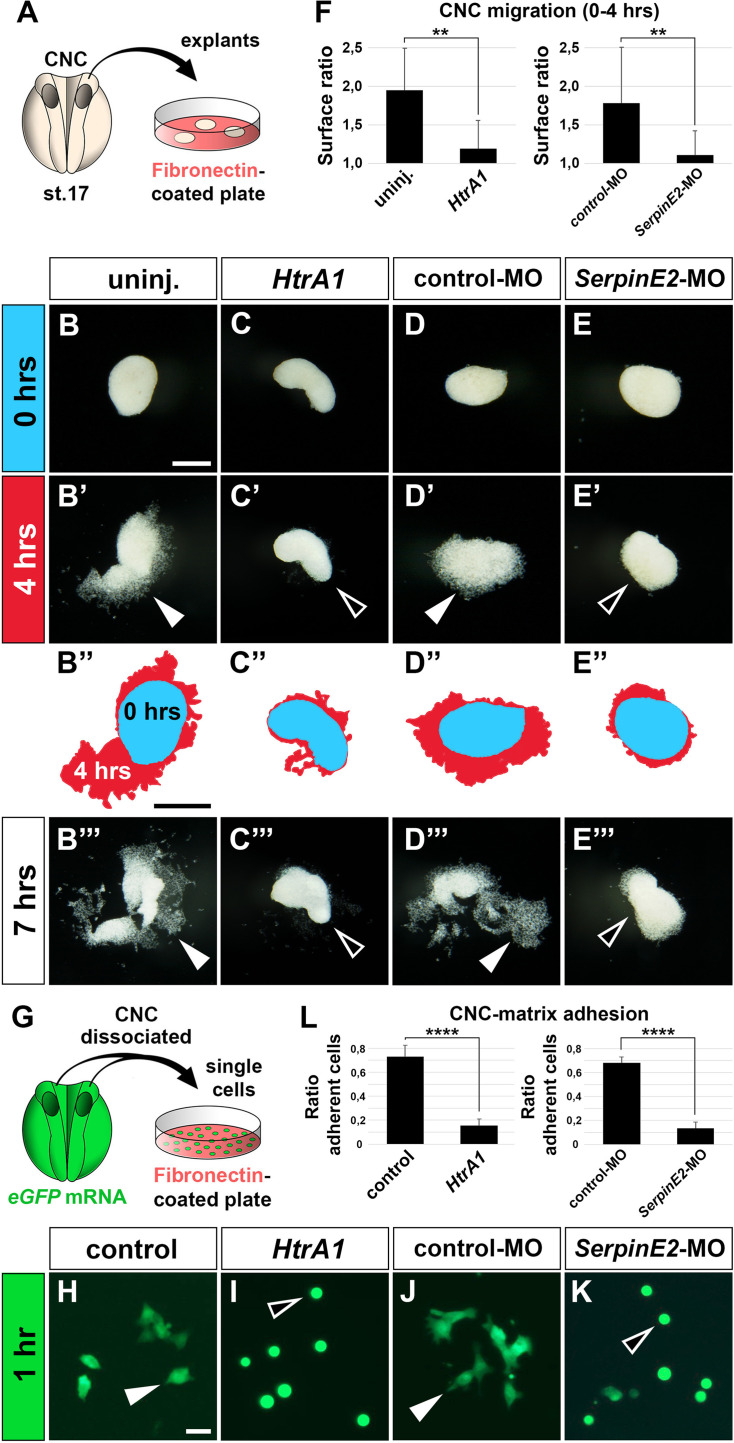
Figure 5. HtrA1 overexpression and SerpinE2 knockdown inhibit cranial neural crest cell migration and adhesion to fibronectin in vitro.
(A) Scheme of migration experiment. The cranial neural crest was explanted from uninjected or injected embryos at stage 17 and cultured on a fibronectin-covered plastic plate. (B–E’’’) Time-lapse of cell migration in CNC explants after culturing for 0, 4, or 7 hr. Note collective cell migration (filled arrowheads) in uninjected controls and explants injected with control-MO, whereas HtrA1 mRNA and SerpinE2-MO block migration (open arrowheads). In B’’–E’’, the surface areas of explants at 0 hr (blue) and 4 hr (red) were determined by ImageJ and superimposed. Scale bar, 0.2 mm. (F) Quantification of initial CNC migration. Indicated is the surface ratio of explants 4 hr versus 0 hr after plating. 12 explants were analyzed per sample. (G) Scheme of adhesion experiment. Upon injection of eGFP mRNA, CNC explants were dissociated in Ca2+- and Mg2+-free medium, and single cells were cultured on a fibronectin plate. (H–K) Single eGFP-labeled CNC cells after 1 hr culture. Note adhering cells with extended cytoplasmic processes (filled arrowheads) in control sample and after co-injection with control-MO, whereas HtrA1 mRNA and SerpinE2-MO prevent adhesion causing injected cells to acquire a round phenotype (open arrowheads). Scale bar, 0.02 mm. (L) Quantification of CNC adhesion. Indicated is the ratio of adherent cells relative to the control. Analysis of n>1600 cells from at least six explants per sample. CNC, cranial neural crest; eGFP, enhanced green fluorescent protein. Embryos were injected with 100 pg mRNAs and 40 ng MOs. Data in all graphs are displayed as mean ± SD, n = 2; **p<0.01, ****p<0.0001, unpaired t-test.

