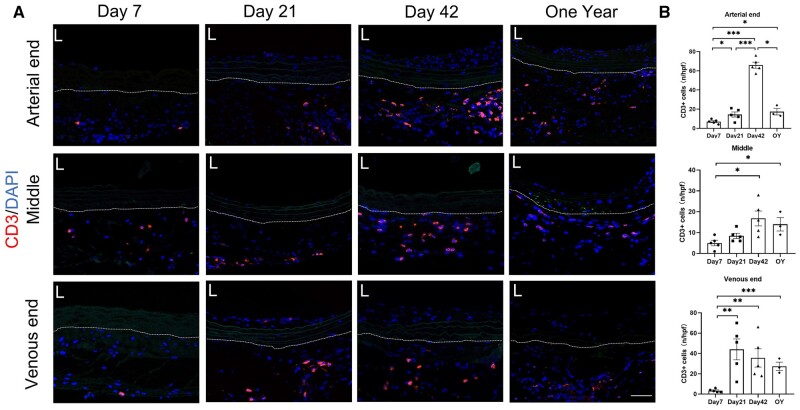
Figure 10.
Accumulation of CD3-positive cells around the decellular vascular graft. (A) CD3-positive cells around the decellular vascular grafts (scale bar, 50 μm). (B) Statistical analysis of CD3-positive cells of arterial end (P < 0.0001, ANOVA; Day 7, Day 21, Day 42, n = 5; 1 year, n = 3), middle segment (P = 0.0151, ANOVA; Day 7, Day 21, Day 42, n = 5; 1 year, n = 3) and venous end (P = 0.0102, ANOVA; Day 7, Day 21, Day 42, n = 5; 1 year, n = 3). The area outside the dashed lines represents the outer of decellularized vascular grafts.

