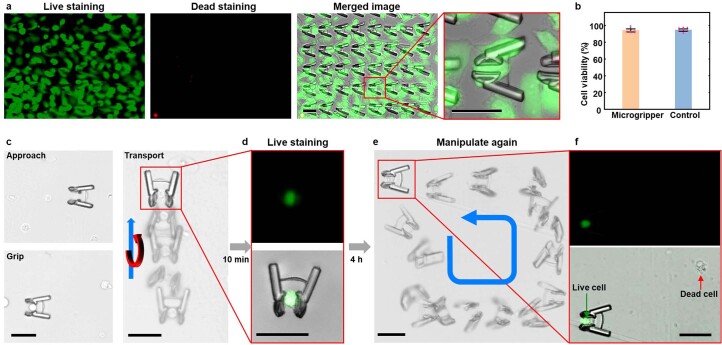
Extended Data Fig. 4. Biocompatibility test of the microgripper.
(a) Live/dead staining of HeLa cells after 48 hours of co-culturing with the microgripper array. Green: Live cells stained by FDA with the emission wavelength of 530 nm; Red: Dead cells stained by PI with the emission wavelength of 618 nm. (b) Comparable cell viability of the HeLa cells after 72 hours of culturing on the microgrippers and commercial cell-culture substrate. Dot plots represent 6 individual samples for each group. Bars represent mean ± s.d. (c) and (d) Manipulation of a live HeLa cell by the microgripper and the subsequent live staining demonstrating the cell′s viability after the manipulation process. (e) Manipulation of the gripped HeLa cell in a rectangular trajectory after 4 hours of co-culturing. (f) Fluorescent images of the observed HeLa cell after 4 hours indicating the harmless interaction of the microgripper with the cell. Blue arrow and blue curved arrow in the motion-sequential images indicate the transport direction of the microgripper. Red curved arrow indicates the rotating direction of the microgripper. All scale bars: 40 μm.

