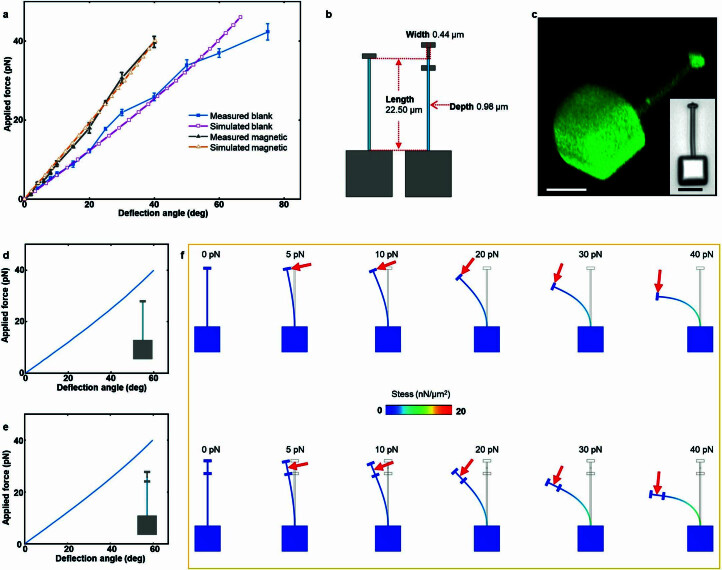
Extended Data Fig. 3. Comparable force responses of the cantilever picospring for modulus characterization and the microforcemeter.
(a) Deflection curves of the cantilever picospring according to experimental results and FEA results. Comparison of blank samples between measured and simulated curves: F value = 0.0081 (ANOVA), Pearson correlation coefficient = 0.9926. Comparison of the magnetic samples between measured and simulated curves: F value = 0.0038 (ANOVA), Pearson correlation coefficient = 0.9984. Measured data are presented as mean ± s.d. (n = 3 picosprings). (b) Comparable geometric characteristics of the microforcemeter used for force measurement (left) and the cantilever picospring used for modulus characterization (right). (c) 3D-reconstructed image of the microforcemeter taken by confocal laser scanning microscopy (CLSM). Inset: optical image. (d) and (e) Highly consistent bending curves of the microforcemeter and cantilever picospring according to FEA simulations. (f) Simulated deflections of these two devices under loads.

