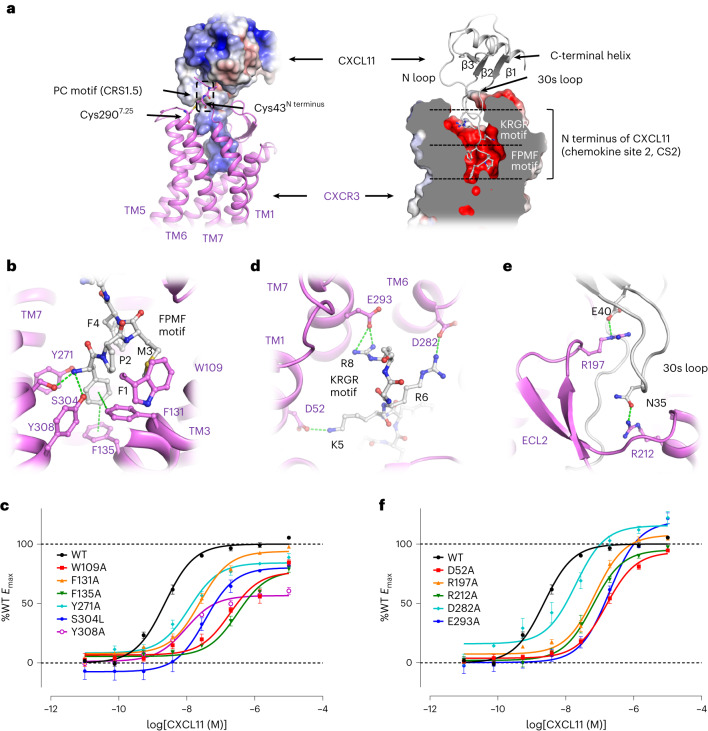
Fig. 2. Interactions between CXCR3 and chemokine CXCL11.
a, A general view of the binding pattern of CXCL11. In the left panel, the surface model of CXCL11 (colored by electronic potential) and the cartoon model of CXCR3 (colored violet) are presented. In the right panel, the cartoon model of CXCL11 (colored gray) and the surface model of CXCR3 (colored by electronic potential) are presented. The PC motif and the disulfide bond between Cys43N-term and Cys2907.25 are shown as sticks in the left panel. The FPMF motif and the KRGR motif buried in the central binding pocket are lined out in the right panel. b, Interactions between the FPMF motif and CXCR3. c, cAMP responses of CXCR3 mutants to CXCL11. d, Interactions between the KRGR motif and CXCR3. e, Interactions between the 30s loop in CXCL11 and the ECL2 in CXCR3. In b, d and e, CXCL11 and CXCR3 are colored gray and violet, respectively. The residues involved in interactions are shown as sticks, and the interactions between residues are indicated with green dashes. f, cAMP responses of CXCR3 mutants to CXCL11. In c and f, cAMP responses are normalized to the percentage agonist activity of wild-type CXCR3 (%WT). The data represent means ± s.e.m. (n = 4 independent experiments for wild-type CXCR3, n = 3 independent experiments for CXCR3 mutants). The expression level of CXCR3 mutants is shown in Extended Data Fig. 4b and the corresponding EC50 is summarized in Extended Data Table 1.

