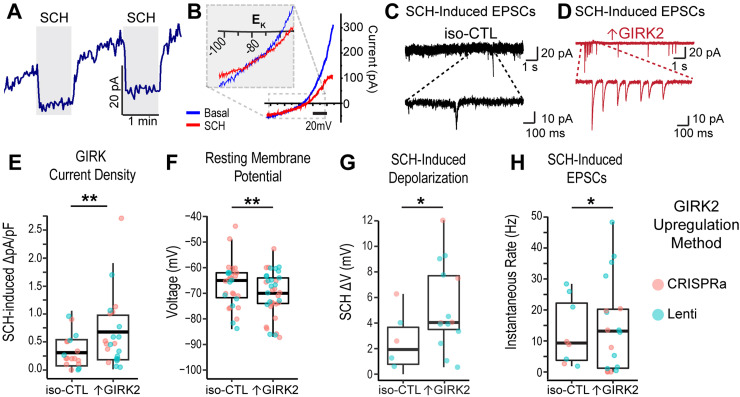
Figure 2.
Increased GIRK2 protein expression alters electrophysiology of human glutamatergic neurons. A, Representative traces of GTPγS-activated current with two 1 min pulses of 30 μM SCH-23390 (gray rectangles) voltage-clamped at −40 mV. B, Representative current–voltage curves of basal (blue) and GIRK2-inhibited (SCH-23390, red traces) currents; inset: magnification of current reversal at the potassium equilibrium potential (EK). C, D, Representative sEPSCs for iso-CTL (black; E) and ↑GIRK2 (red; F) neurons with SCH pulse. Main trace, 10 s; magnified inset, 1 s. E–H, Boxplots showing mean (middle bar), upper and lower quartiles (box), and 1.5 interquartile range (whiskers) of (E) SCH-inhibited GIRK current density [pA/pF; N = 19 iso-CTL cells (12 scr-gRNA + 7 no virus); 23 ↑GIRK2 (11 CRISPRa + 12 Lenti)]; F, resting membrane potential [N = 29 iso-CTL cells (20 scr-gRNA + 9 no virus); 37↑GIRK2 (20 CRISPRa + 17 Lenti)]; G, SCH-induced shift in resting membrane potential [N = 6 iso-CTL cells (2 scr-gRNA + 4 no virus); 13 ↑GIRK2 (3 CRISPRa + 10 Lenti)]; and H, instantaneous sEPSC rate (Hz) with SCH [N = 8 iso-CTL cells (3 scr-gRNA + 5 no virus); 18↑GIRK2 (7 CRISPRa + 11 Lenti)]. Each point represents a cell; point color indicates GIRK2 expression method (coral, CRISPRa; teal, Lenti). Statistics: GLMM with expression method and batch random effects. *p < 0.05, **p < 0.01. See Extended Data Table 2-1 for additional patch properties (membrane capacitance, access resistance, rheobase, and action potential threshold).

