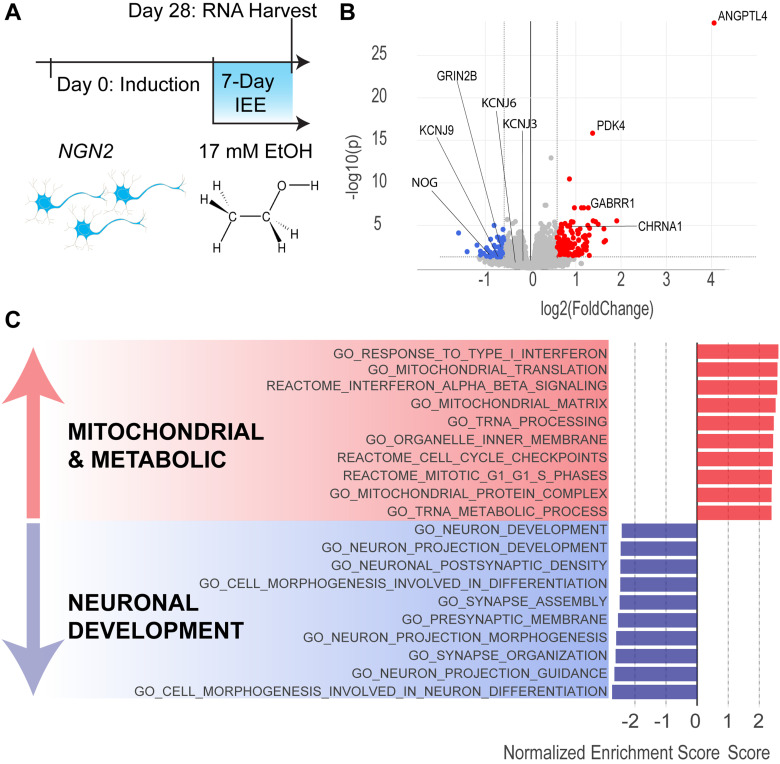
Figure 3.
Seven-day IEE increases expression of mitochondrial and metabolic genes and impairs neuronal development genes. A, Timeline for neuronal induction, intermittent 17 mM ethanol exposure, and RNA harvest. B, Volcano plot of DEGs (fold-change = 1.5 and p value = 0.05 cutoffs). Blue dots represent downregulated genes and red dots represent upregulated genes. C, GO categories of DEGs. Bars depict normalized enrichment score for each category. See Extended Data Table 3-1 for complete list of significant DEGs. N = 4 donors, 2 batches, 4 replicate wells.

