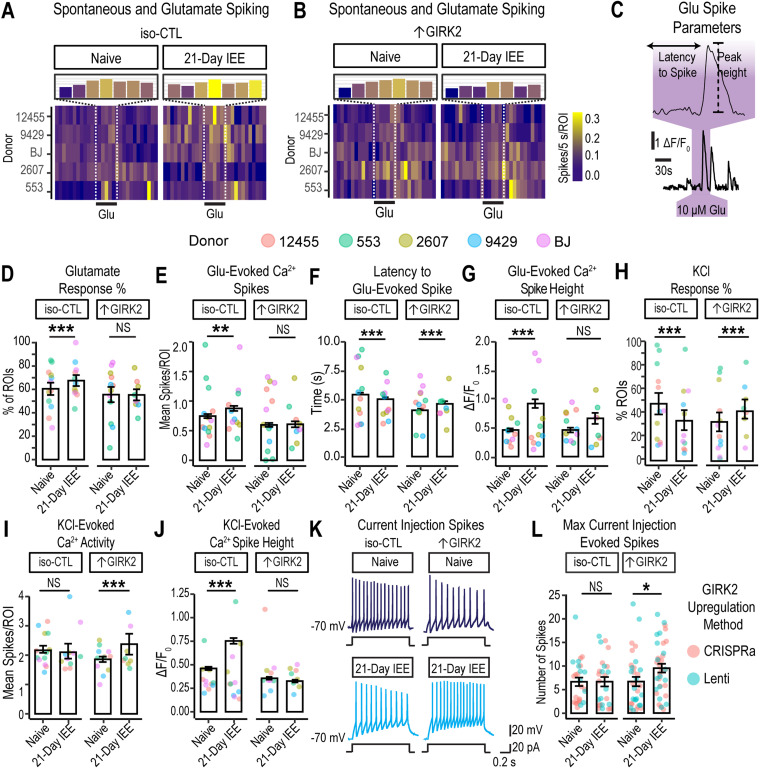
Figure 6.
Increased GIRK2 expression and IEE impact glutamate response and membrane excitability in glutamatergic neurons. A, B, Calcium spiking activity heatmap for iso-CTL (A) and ↑GIRK2 (B) neurons, either naive and with 21 d IEE. Five-second bins, normalized to number of cells (spikes/5 s/ROI). Inset magnification shows number calcium spikes/5 s/ROI during the 30 s pulse of 10 μM glutamate. Color gradient indicates activity intensity (violet-blue, low; yellow, high). C, Example deconvolved Ca2+ fluorescence trace and latency to spike with a 30 s glutamate pulse. D, Percentage of excitatory neurons responsive to 30 s glutamate pulse (10 µM). (See Extended Data Table 6-1 for complete list of all active neuronal ROI Ns for each replicate experiment.) E, Number of calcium spikes during each 30 s glutamate pulse (see Extended Data Table 6-2 for complete list of all glutamate-responsive ROI Ns for each replicate experiment). F, Latency to spike (s) in response to 30 s glutamate, pulse (10 µM). G, Calcium peak height (ΔF/F0) evoked by glutamate for iso-CTL and ↑GIRK2 neurons, either ethanol-naive or with 21 d IEE. H, Percentage of ROIs responsive to 15 mM KCl. I, Number of spikes evoked by 1 min 15 mM KCl pulse. J, Ca2+ spike height during 1 min 15 mM KCl (ΔF/F0). KCl (N = 1,203–2,608 ROIs/group). Point color indicates donor (coral, 12455; dark yellow, 2607; green, 553; blue, 9429; and purple, BJ; see Extended Data Table 6-3 for complete list of glutamate-responsive and KCl-active ROI Ns for each replicate experiment). K, Representative action potentials evoked by 1 s current injection step (20 pA) in naive and 21 d IEE iso-CTL and ↑GIRK2 neurons. L, Maximum number of evoked spikes measured in current-clamp with 20 pA current injection steps from holding potential of approximately −70 mV (N = iso-CTL: 26 naive, 25 21 d IEE; ↑GIRK2: 33 naive, 37 21 d IEE). Point color indicates upregulation method (coral, CRISPRa; teal, Lenti). GLMM includes batch and donor effects. *p < 0.05, **p < 0.01, ***p < 0.001.

