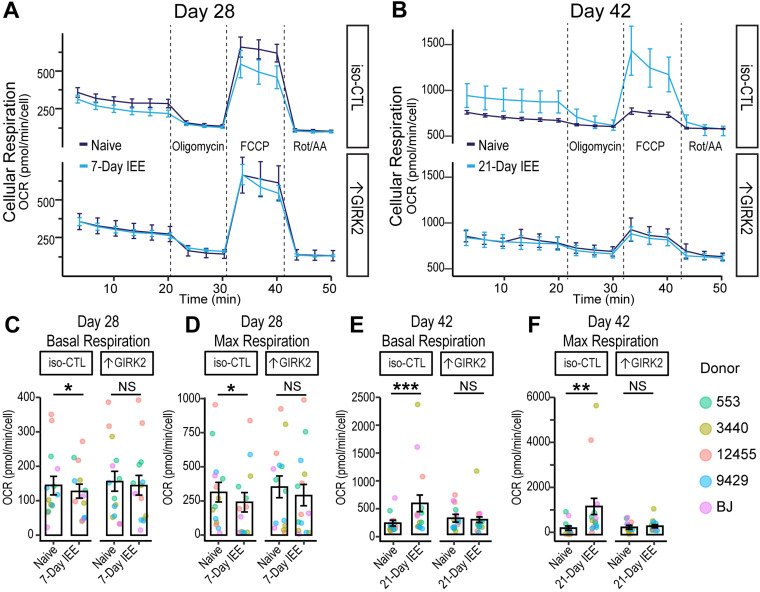
Figure 8.
↑GIRK2 expression counteracts effects of IEE on mitochondrial function. A, B, Time course of cell density-normalized OCR (pmol/minute/cell) during the mitochondrial stress test in CTL and ↑GIRK2 neurons at Day 28 (7 d IEE; A) and Day 42 (21 d IEE; B) postinduction. Line color indicates ethanol exposure: dark blue, naive; light blue, IEE. C–F, Day 28 postinduction basal (C) and maximal OCR (pmol/min/cell; D) and D42 basal (E) and maximal (F) OCR in WT and ↑GIRK2 neurons naive to ethanol or with IEE. *p < 0.05, **p < 0.01, ***p < 0.001.

