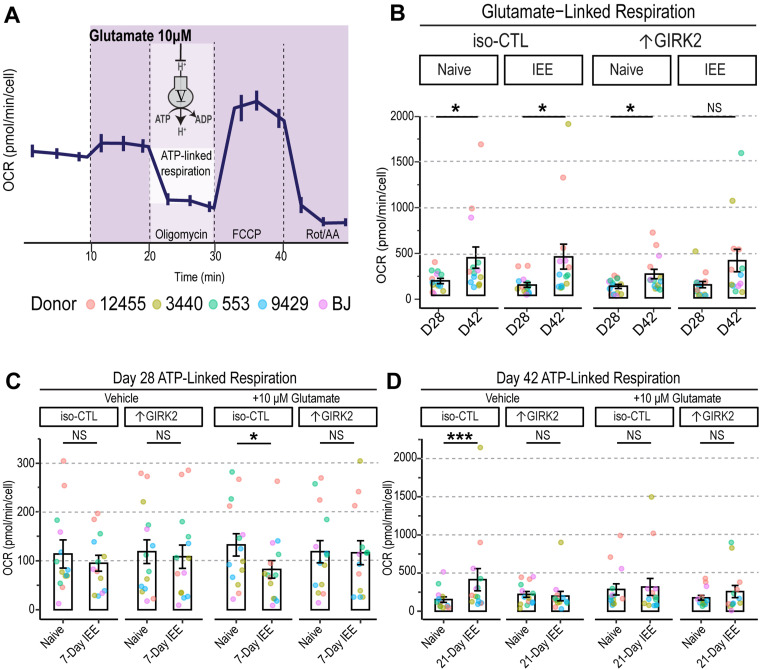
Figure 9.
↑GIRK2 expression counteracts IEE-induced deficit in ATP production in the presence of glutamate. A, Schematic representation of acute 10 µM glutamate injection during the mitochondrial stress test and mechanism of ATP-linked respiration measurement. B, Glutamate linked respiration in iso-CTL and ↑GIRK2 NGN2 neurons at 28- and 42 d postinduction (D28 and D42, respectively). Each point represents an average of 4 wells from 3 replicate experiments (N = 5 donors). C, D, ATP-linked respiration in D28 (C) and D42 (D) neuron naive to ethanol or with IEE during basal (vehicle) and stimulated (10 μM glutamate) conditions (pmol/min/cell). Each point represents and average of 4 wells from 3 replicate experiments (N = 5 donors). Point color indicates donor (coral, 12455; dark yellow, 3440; green, 553; blue, 9429; purple, BJ). GLMM includes donor and batch effects. *p < 0.05, **p < 0.01, ***p < 0.001.

