
Fig. 2.
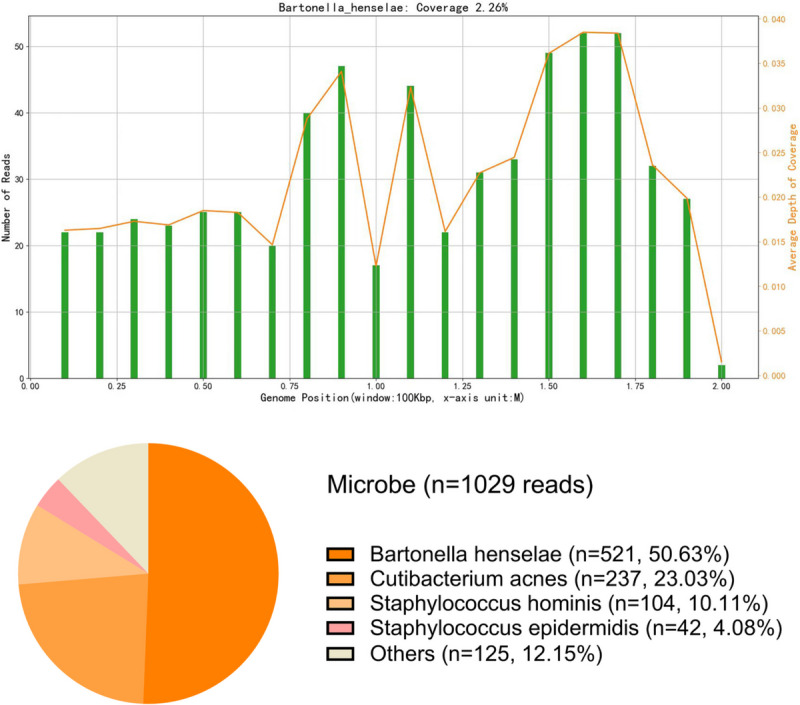
The mNGS results from the aqueous humour sample showed that the coverage of Bartonella henselae reads was 2.26% with an equal distribution. These reads accounted for the largest proportion of identified pathogen reads. In the upper figure, the reference data of Bartonella henselae genome (about 1.9M) were divided into 20 subunits (100Kbp). The number of reads aligned to each subunit and the average depth of coverage were presented in Y-axis