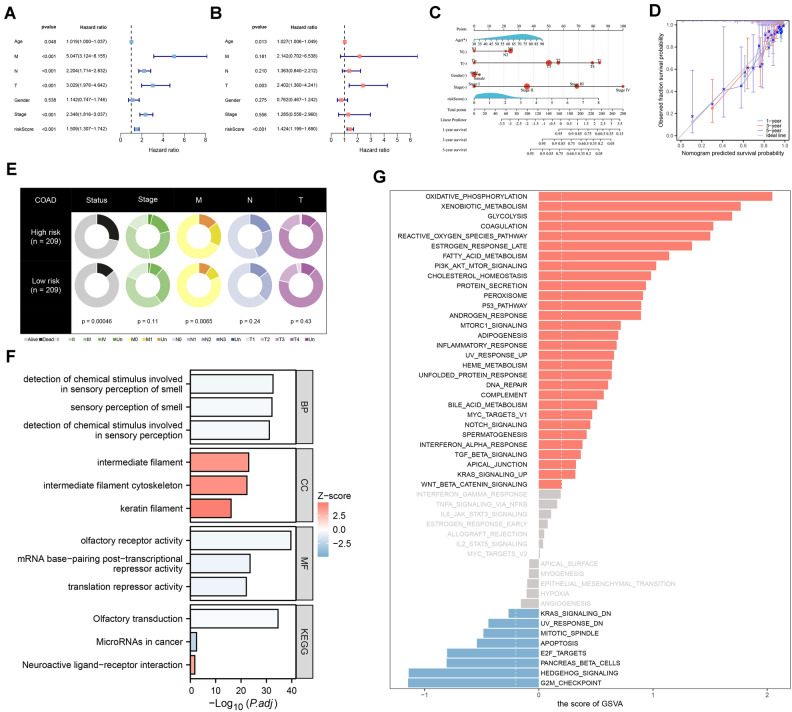
Figure 3.
Analyzing the signature and functional enrichment. Notes: (A, B) The univariate and multivariate analyses of the survival time of signature. (C) Prediction of 1-, 3-, and 5-year survival probabilities relying on a nomogram. (D) Calibration curve used to estimate nomogram accuracy. (E) Pie charts displaying the risk group clinical characteristics. (F) Displaying enriched biological processes using GO and KEGG. (G) Identifying significant enrichment pathways among the risk groups. p < 0.05.

