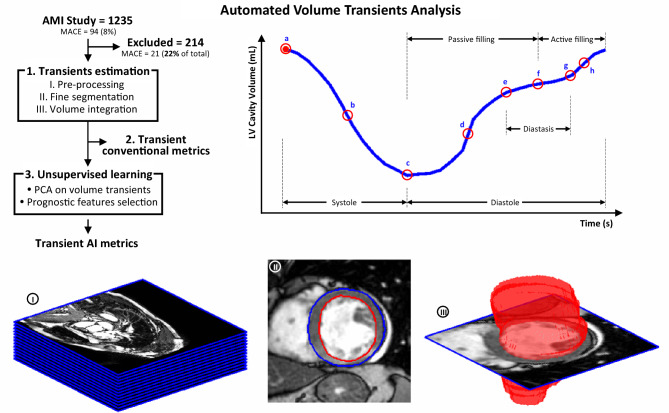
Figure 2.
Automated volume transient analysis. LV fully automated volume transient analysis pipeline (top-left), along with patient S692 sample case, consisting of the following steps: (1.I.) the SAx stack (image I) is pre-processed normalizing for intensity, resolution and orientation and cropped to the region of interest, following the prior detection of the heart; (1.II.) the LV myocardium is fine segmented in the SAx stack (image II); (1.III) a volumetric segmentation is synthesized (image III) and the LV volume transient derived; (2) the conventional metrics of the volume transient are estimated (top-right); and (3) PCA analysis is applied on the transients to facilitate the supervise learning of MACE occurrence related features (AI-derived transient metrics). The red circle landmarks on the representative volume transient (top-right) correspond to: a, end-diastole; b, systolic peak velocity; c, end-systole; d, passive filling peak velocity; e, beginning of diastasis; f, mid-diastasis; g, end-diastasis; and h, active filling peak velocity. This figure is available in video format (see Supplementary Video 1).

