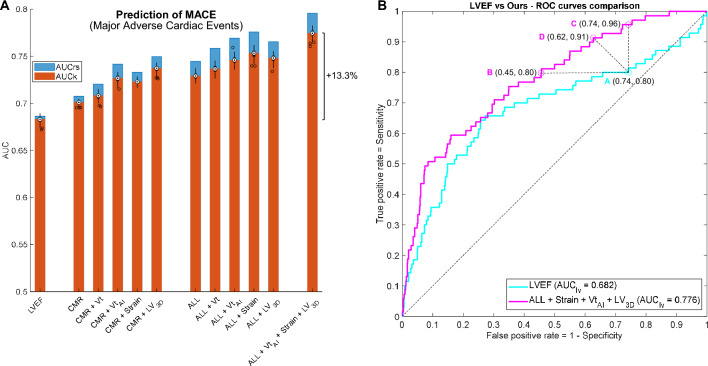
Figure 5.
MACE prediction results and interpretation of the AUC differences. (A): MACE prediction performance results and prognostic contribution of the 3 proposed directions of enhancement. The performance of LVEF, the most established marker for AMI prognosis, is included as reference. Selection of significant variables is based on LDA multivariable stepwise analysis, and results are expressed in AUC resubstitution (rs, blue) and AUC 10-cross-fold validation (k, orange), repeated for a hundred random data splits (black distributions). All differences in performance were significant (P < 0.001). Note the remarkable improvement of the final configuration, combining the 3 proposed directions of enhancement. (B): Interpretation and implications of the AUC differences in ROC prediction curves, illustrated by the comparison between LVEF and our multivariable model, combining the 3 directions of enhancement. Given a recommended operating point of high sensitivity (80%) in the LVEF curve (point A), our model is able to predict MACE at the same sensitivity but reducing the false positive rate a 40% (point B), i. e., removing 379 false positive MACE predictions. Likewise, when operating at a similar false positive rate than LVEF (point C), our method improves sensitivity by 20%, detecting 96% of the MACE cases. Alternatively, the operating point D of our model could be chosen for MACE prediction, where both sensitivity and specificity are improved with respect to LVEF. This illustrates the potential for risk management improvement associated to superior AUC scores.

