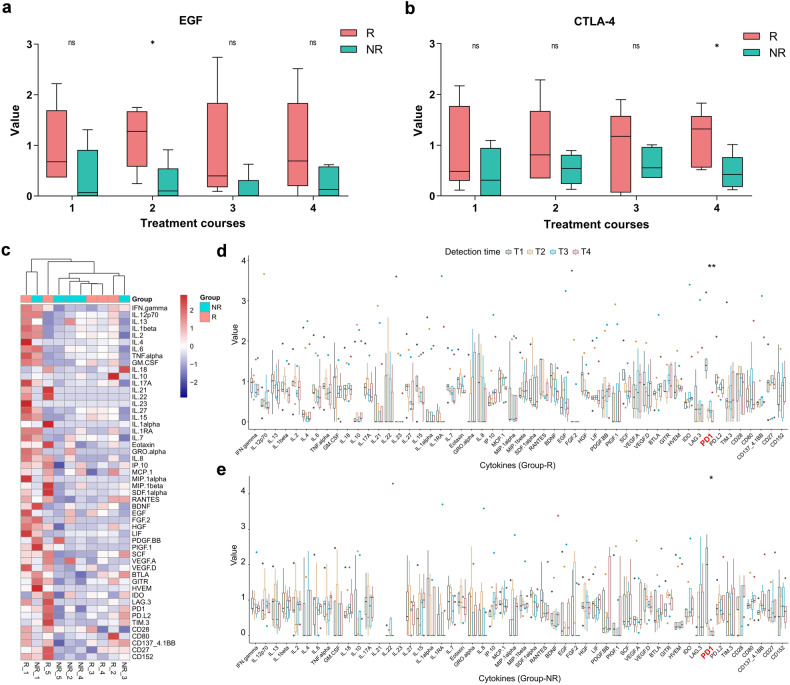
Fig. 5.
The results of cytokines detection of group-R (n = 5) and group-NR (n = 5) patients. The concentration values of EGF (a) and CTLA-4 (b) of patients in group-R (red) and group-NR (green) at every time point (T1–T4). c The clustering of two-group patients based on cytokines in the pre-treatment blood (T1). The concentration values of various cytokines at different time points (T1–T4) in group-R (d) and group-NR (e) patients. With *P < 0.05, **P < 0.01, ***P < 0.001 and ‘ns’ for no significant difference

