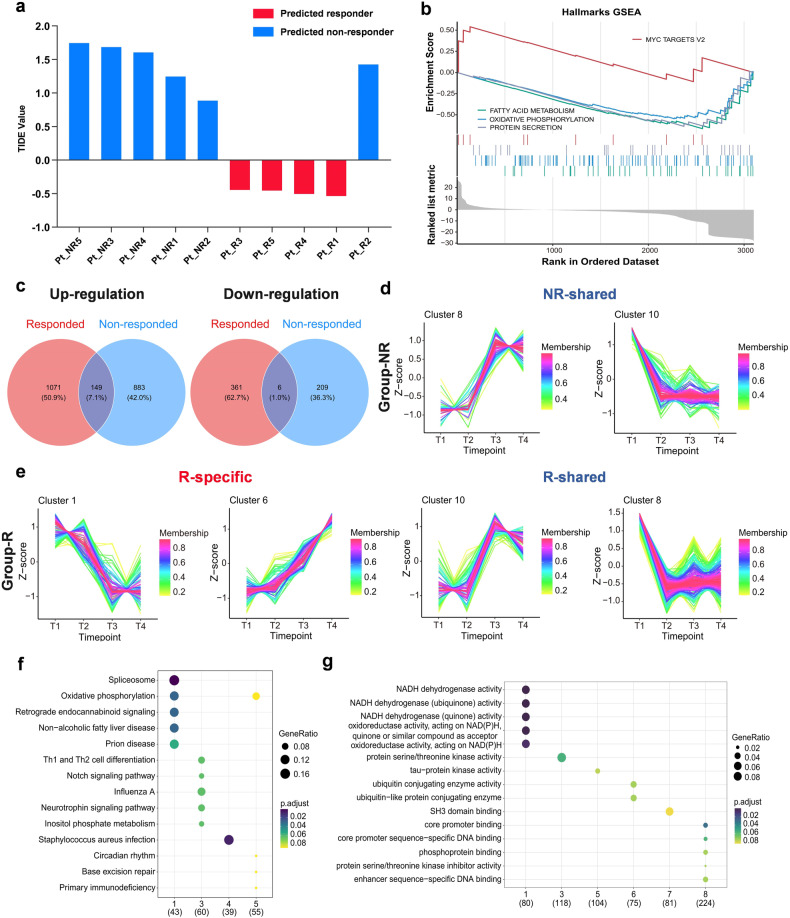
Fig. 6.
The gene expression profiles of group-R (n = 5) and group-NR (n = 5) patients. a The availability of the obtained exosomal RNA of patients was verified using the “TIDE” model, and patients were predicted as responders (red) or non-responders (blue). b Gene set enrichment analysis (GSEA) according to “Hallmark” gene sets from MsigDB. c Up- and down-regulated genes after medication (T2/T3/T4 vs. T1) in group-R (red) and group-NR (blue) patients. Time-series clustering analysis was taken to observe the trend of genes expression over time (T1–T4) in patients of group-NR (d) and -R (e); the horizontal axis showed different time points, and the vertical axis showed the gene expression after standardization, which was the mean expression value of patients in each group for one certain gene. KEGG (f) and GO (g) enrichment analyses according to different time-series clusters

