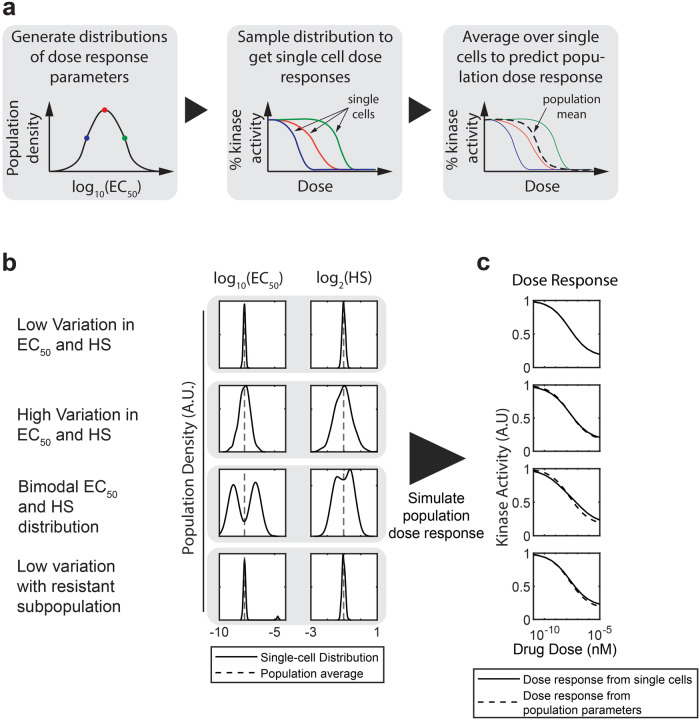
Fig. 1. Modeling dose responses from heterogeneous populations.
a Schematic of model showing how we generate individual dose responses by sampling from distributions of parameters and then averaging across sampled cells to simulate the population dose response. b Simulated population densities (smoothed histograms of the proportion of cells with a given dose response parameter value) of EC50 and Hill slope parameters for four different hypothetical populations. Dashed lines represent the EC50 or Hill slope inferred from population level data, while solid lines are the simulated distribution. Note that all four populations have almost identical population means. c The resulting overall dose responses from averaging over cells sampled from each population in (b). Solid lines represent the average from sampling each population 1000 times, while the dashed line represents the dose response from the measured population dose response parameters (dashed lines in b).

