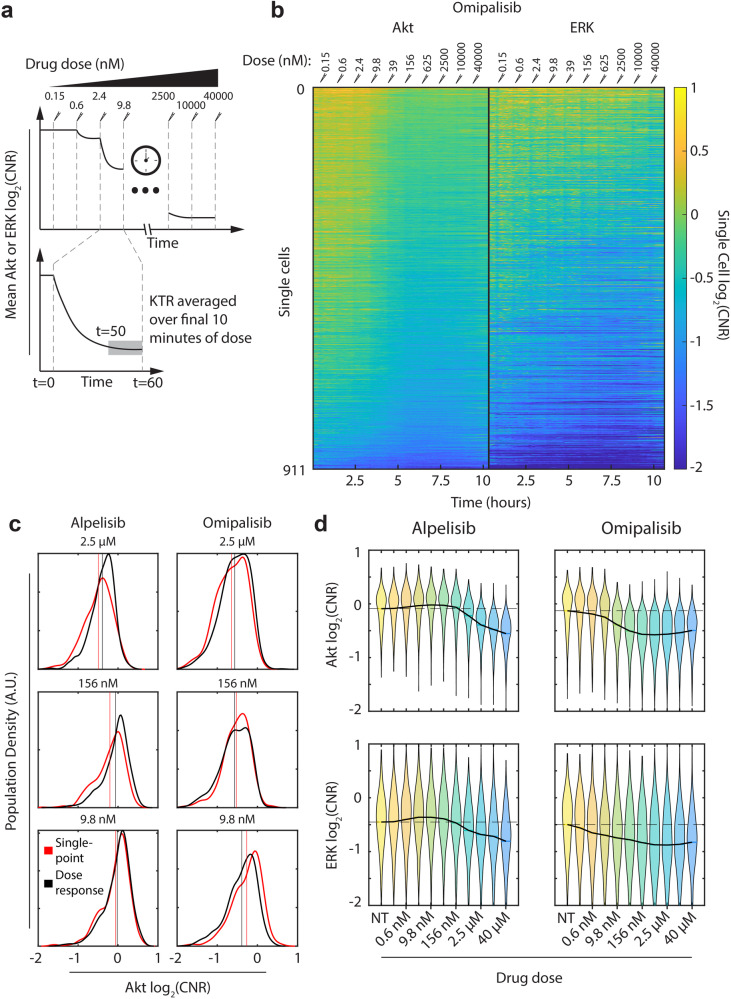
Fig. 3. Measuring dose responses in individual cells.
a Experimental approach. Cells are exposed to a single concentration of alpelisib or omipalisib for an h, and the single-cell response is averaged over the last 10 min of exposure. Then, a higher concentration is added. Each concentration is 4× greater than the previous one. Concentrations range from 150 pM to 40 μM. b Kymograph showing single-cell trajectories of each MCF-7 cell measured in an omipalisib dose-response experiment. Each row is a single cell, and each column is a different time point, with color representing the signaling activity. Paired Akt and ERK trajectories are shown, with Akt on the left and ERK on the right. Cells are sorted by the area under the curve of their Akt trajectory. The dose of omipalisib at each timepoint is shown at the top of the kymograph. c Comparison of Akt signaling distributions when exposed to a given drug concentration in a single-point experiment (red) and a dose response experiment (gray). Each distribution was generated using kernel smoothing. Vertical lines indicate the population mean of each distribution. d Akt (top) and ERK (bottom) dose-dependent signaling activity in response to alpelisib (left) and omipalisib (right). In each plot, the distribution of signaling activity is shown as a violin, while the mean dose response is indicated with a solid black line. A horizontal dashed black line is included at the untreated mean to guide the eye. The full list of doses used in the figure, from left to right in increasing order, is: No treatment (NT), 0.15 nM, 0.6 nM, 2.4 nM, 9.8 nM, 39 nM, 156 nM, 625 nM, 2.5 μM, 10 μM, 40 μM.

