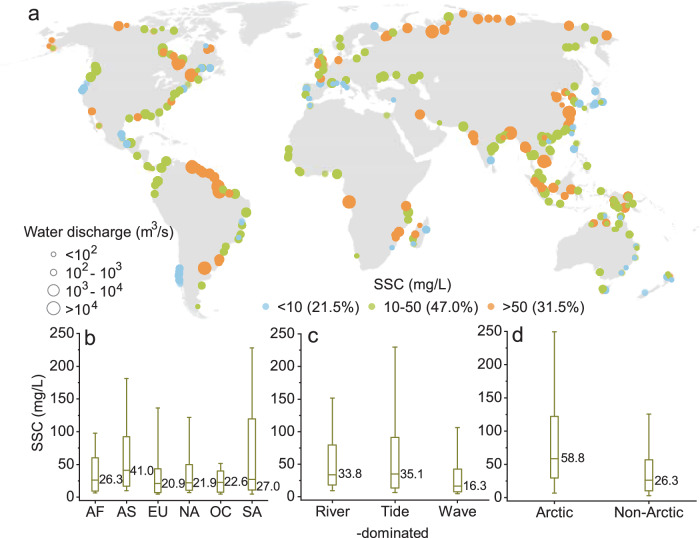
Fig. 1. Global pattern of coastal suspended sediment concentration (SSC) between 2000 and 2020.
a The long-term mean SSC (unit: mg/L) for 349 deltas. The different circle sizes represent varying magnitudes of water discharge, while the different circle colors indicate different levels of SSC. b–d Box plots of long-term mean SSC in different continents (AF:Africa, AS:Asia, EU:Europe, NA:North America, OC:Oceania, SA:South America) (b), various delta morphologies (c), and the Arctic (with latitude >50°N) and non-Arctic deltas (d). The box plots in b–d show the distributions (10, 25, 50, 75, and 90% values) of SSC.

