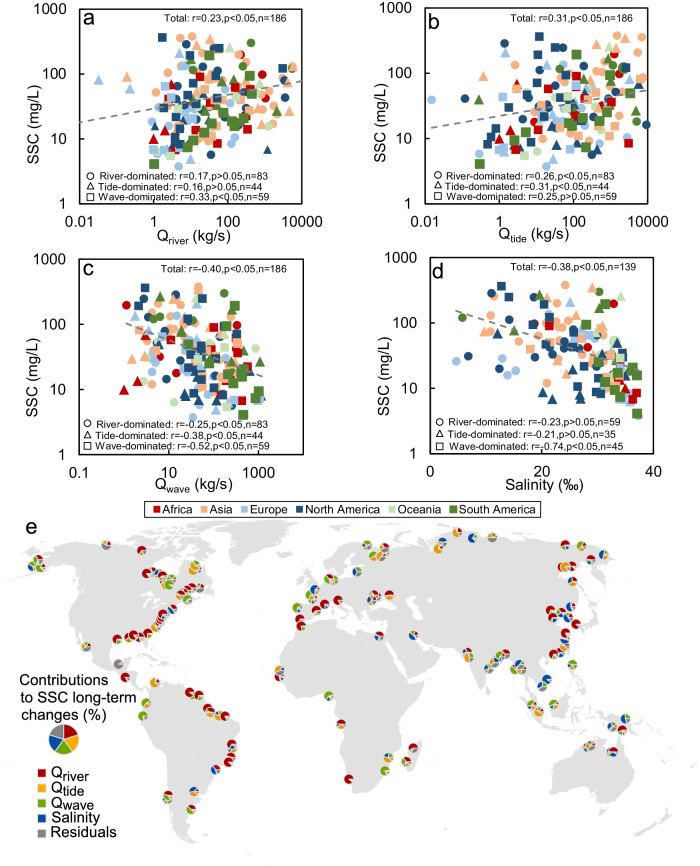
Fig. 4. Relationships between long-term mean suspended sediment concentration (SSC), Qriver, Qtide, Qwave, and salinity.
a–d The relationships between SSC and Qriver (a), Qtide (b), Qwave (c), and salinity (d). The number of deltas (n), correlation coefficients (r), and p values were annotated. Out of our 349 deltas, the Qriver is only available for 186 deltas and salinity is available for 139 deltas, thereby the relationship analyses between Qriver, Qtide, Qwave, salinity, and SSC were conducted for these deltas. The correlation coefficients are obtained based on the logarithm-transformed SSC and different factors. e Contributions of four drivers (Qriver, Qtide, Qwave, and salinity) on long-term SSC changes in 139 river deltas. The contributions (see Supplementary Table 3) of four drivers in each delta are presented through pie charts. The pie charts consist of five colors, representing the four drivers and residuals, with the size of each slice indicating the respective proportion.

