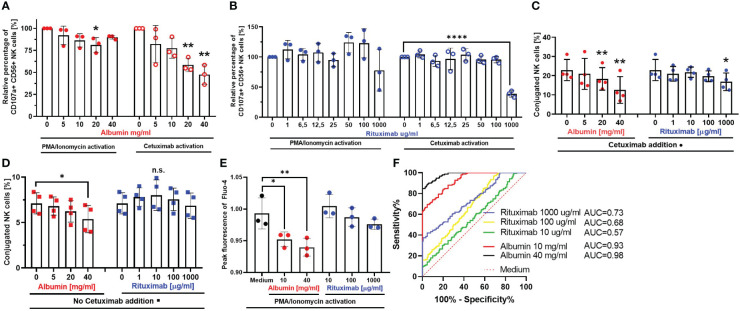
Figure 3.
Irrelevant antibodies and serum proteins interfere with various NK cell effector functions. Spontaneous NK cell degranulation and ADCC in the presence of serum protein albumin (A) or irrelevant antibody Rituximab (B) NK cells were stimulated with PMA (50 ng/mL)/Ionomycin (1 µg/mL) (left panels) or coincubated with IGROV-1 (1:1 ratio) and Cetuximab (1 µg/mL) (right panels) in the presence of either albumin (5, 10, 20, and 40 mg/mL) or Rituximab (1, 6.5, 12.5, 25, 50, 100, and 1,000 μg/mL) for 6 h. Percentage of CD107a-positive NK cells was assessed by flow cytometry. (C, D) NK-TC conjugation in the presence (C) or absence (D) of Cetuximab. NK cells and IGROV1- cells were mixed in 4:1 effector-to-target ratio and the addition of albumin (5, 10, 20, and 40 mg/mL) or Rituximab (1, 10, 100, and 1,000 μg/mL) with (C) or without (D) Cetuximab (1 µg/mL). Percentage of NK-TC-conjugates was assessed by flow cytometry. (E, F) Intracellular calcium-flux during NK cell stimulation in the presence of albumin and Rituximab. NK cells were exposed to PMA (50 ng/mL)/Ionomycin (1 µg/mL) in the presence of either medium or medium supplemented with albumin (10 and 40 mg/mL) and Rituximab (10,100, and 1,000 μg/mL), respectively. Intracellular Ca2+ flux was monitored via Fluo-4 dye. (E) Fold increase of 480/25 absorbance at peak of calcium flux. (F) ROC analysis shows significant difference between calcium flux curves in albumin (red and black line) compared to medium (dotted red line). Each datapoint represents one ascites sample. For significance testing, ordinary one-way ANOVA (A–E) with Dunnett’s post-hoc test and ROC analysis (F) were performed. ns, non-significant; *p < 0.05, **p < 0.01, ****p < 0.0001.

