Figure 4.
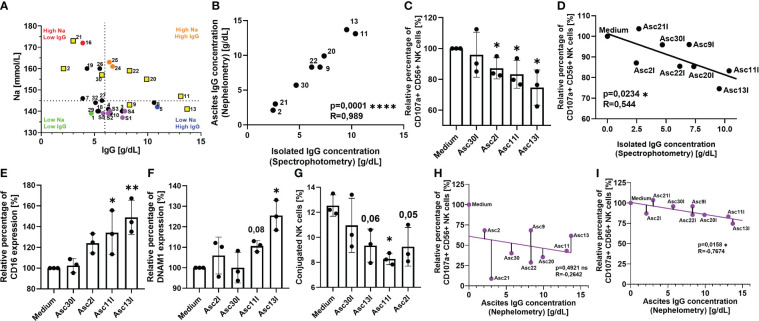
Antibodies isolated from ascites samples competitively inhibit Cetuximab-mediated NK cell cytotoxicity. (A) Ascites samples have heterogeneous sodium and IgG composition. Pearson correlation of sodium and IgG content in ascites and serum samples as determined by clinical chemistry. Dotted line divides ascites samples into high-sodium/low-sodium (red/orange versus green/blue) and high-IgG/low-IgG (orange/blue versus red/green) using physiological referent values for both components, serum samples are marked in purple. Yellow squares mark selected ascites samples for IgG isolation. (B) Quantification of ascites IgG immunoglobulins isolated by chromatography. UV absorbance at 280 nm was used to estimate amount of isolated IgG (black dots). Pearson correlation of isolated IgG immunoglobulins to nephelometry quantified ascites immunoglobulins. (C, D) NK ADCC in the presence of ascites isolated immunoglobulins. Resting healthy donor NK cells were coincubated in 1:1 ratio with A431 cells for 6 h with the addition of ADCC-inducing anti-EGFR-antibody Cetuximab (1 µg/mL) and 25% addition of isolated ascites immunoglobulins. (C) NK ADCC in the presence of ascites isolated immunoglobulins. NK ADCC was quantified by flow cytometry after 6 h of coincubation. (D) Pearson correlation shows significant correlation of NK ADCC to ascites isolated immunoglobulins. (E, F) Expression of surface markers on NK cells in the presence of isolated ascites immunoglobulins. Isolated healthy donor NK cells were coincubated with A431 cells (1:1 ratio) and Cetuximab (1 μg/mL) in either medium or medium supplemented with 25% of isolated immunoglobulin suspension. After 18 h, expression of (E) CD16 and (F) DNAM-1 were measured by FACS. (G) Ascites isolated immunoglobulins impair NK-TC conjugation. NK cells and A431 were mixed in 1:4 effector-to-target ratio in either normal medium or medium with 25% addition of isolated ascites immunoglobulins. Percentage of NK-TC-conjugates was assessed by flow cytometry. (H, I) Electrolyte imbalance in malignant ascites masks the inhibitory effect of immunoglobulins. (H) Pearson correlation of ascites IgG content to NK ADCC in the presence of unprocessed ascites. (I) Pearson correlation of ascites IgG content to NK ADCC in the presence of isolated ascites immunoglobulins. Each datapoint represents one healthy donor. The relative percentages are shown after normalization to normal medium control. For significance testing, two-tailed Pearson correlation (A, B, D, H, I), ordinary one-way ANOVA followed by Dunnett’s post-hoc test (E–G), and unpaired t-test (C) were used. ns, non-significant; *p < 0.05, **p < 0.01, ****p < 0.0001.

