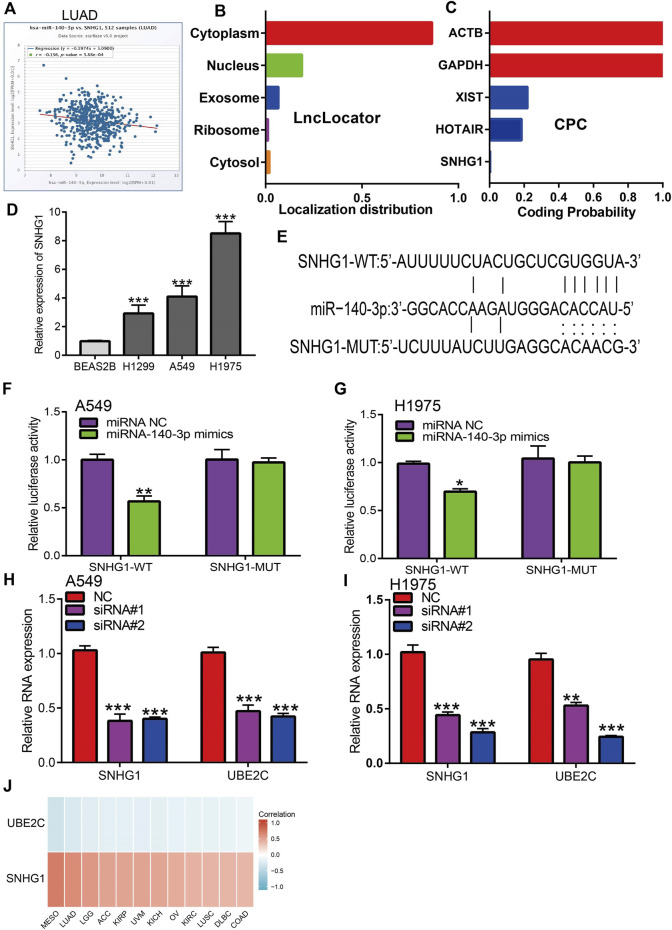
FIGURE 9.
Analysis of upstream lncRNA of miRNA-140-3p in pan-cancer. (A) The correlation between the SNHG1 and miRNA-140-3p in LUAD analysis by Starbase. (B) The subcellular localization of SNHG1 examined by lncLocator. (C) The coding potential of SNHG1 analysis by coding the potential calculator. (D) The expression of SNHG1 in NSCLC cell lines examined by qRT-PCR assay. (E) The target sites between miRNA-140-3p and SNHG1 was predicted by Starbase. (F,G) Relative luciferase activities of wild-type (WT) and mutated (MUT) SNHG1 reporter plasmid in A549 and H1975 cells co-transfected with miR-140-3p mimics examined by luciferase reporter assay. (H,I) The expression of UBE2C after depletion of SNHG1 in NSCLC cell lines examined by qRT-PCR assay. (J) The correlation between miRNA-140-3p and UBE2C, SNHG1 in NSCLC examined by Starbase. * p < 0.05, ** p < 0.01, *** p < 0.001.

