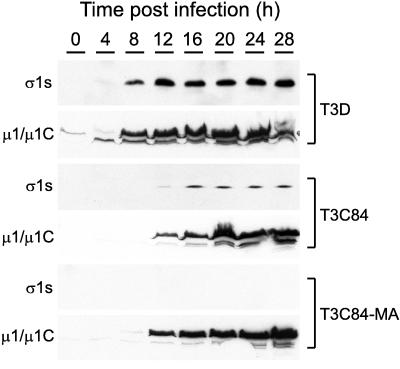
FIG. 3.
Time course of ς1s and μ1/μ1C expression during reovirus infection of L cells. Cells were infected with either T3D, T3C84, or T3C84-MA at an MOI of 10 PFU per cell and harvested at the time points indicated. Cytoplasmic extracts were prepared and electrophoresed in a 14% polyacrylamide gel (100 μg of protein per lane), transferred to nitrocellulose, and blotted with either anti-ς1s MAb 2F4 (5 μg per ml) or anti-μ1/μ1C MAb 8H6 (5 μg per ml).

