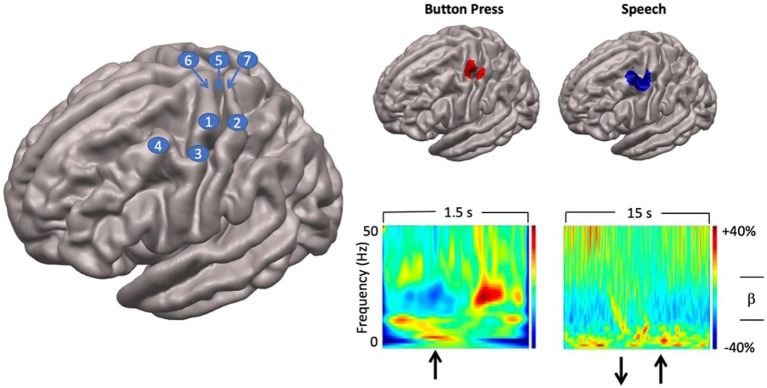
Figure 3.
Localisation of speech motor cortex. Left: anatomical landmarks. 1—hand regions of precentral gyrus (hand knob); 2—hand region of postcentral gyrus; 3—middle precentral gyrus; 4—middle frontal gyrus; 5—rolandic fissure; 6—precentral gyrus; 7—postcentral gyrus. Top right panel: SAM beamformer maps. Button press task elicited activation of hand region of pre (motor) and postcentral (somatosensory) gyri. Speech task shows maximal activation in middle precentral gyrus, immediately ventral to the hand motor region of the precentral gyrus. Speech activation cluster also encompasses the middle frontal gyrus immediately adjacent to the middle precentral speech region. Bottom right panel: time-frequency plots showing temporal evolution of oscillatory responses at virtual sensors placed at locations of cluster maxima shown above. For button press task, upward arrow indicates time of button press onset. For speech task, downward arrow shows speech trial set offset, upward arrow shows speech trial set onset.

