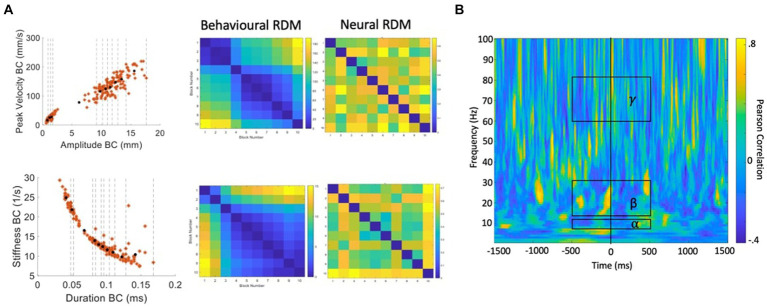
Figure 7.
Procedure for calculation of behavioural and neural correlations. (A) Velocity versus amplitude and stiffness versus duration profiles are partitioned into 10 blocks containing equal numbers of trials. Distances between each partition based on the partition mean coordinates are used to generate the behavioural RDMs. For each partition, the same trials of MEG data are input to MVPA classification analysis. The resulting classification (accuracy) metric is used to generate a neural RDM, for each time-frequency point. (B) A time-frequency correlation matrix resulting from correlating the (in this case, stiffness-duration) behavioural RDM with the neural RDM for each time-frequency point. Group statistics/model evaluation are performed for the mean alpha, beta, and gamma frequency bands within the time range of -500 to +500 ms from onset of the BC opening movement.

