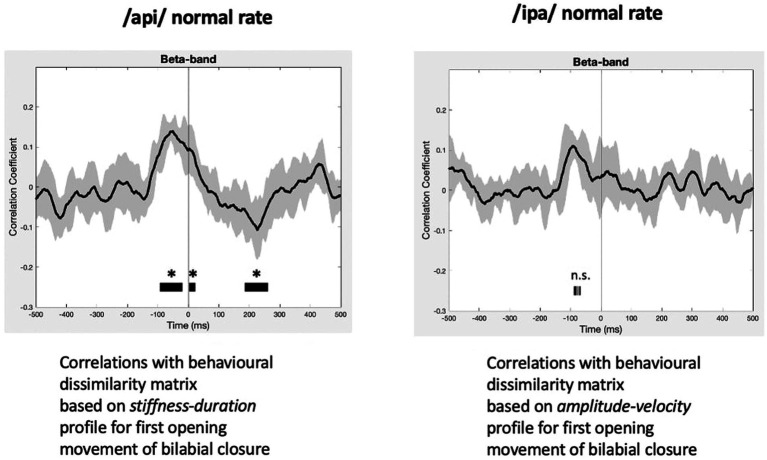
Figure 8.
RSA model evaluation. Black lines show group mean correlations between behavioural and neural RDMs; shading shows standard errors. Left panel: The beta-band profile for /api/ normal rate shows three significant correlational clusters against the stiffness-duration RDM. The first positive cluster begins about 90 ms prior to onset of the first opening movement of BC. A second positive cluster occurs beginning at time zero, and a third cluster of weak negative correlations begins about 180 ms post movement-onset. Right panel: Beta correlation against amplitude-velocity time profile shows a similar positive peak circa -90 ms, although the t-value clusters do not survive cluster correction for FDR rate.

