Figure 4.
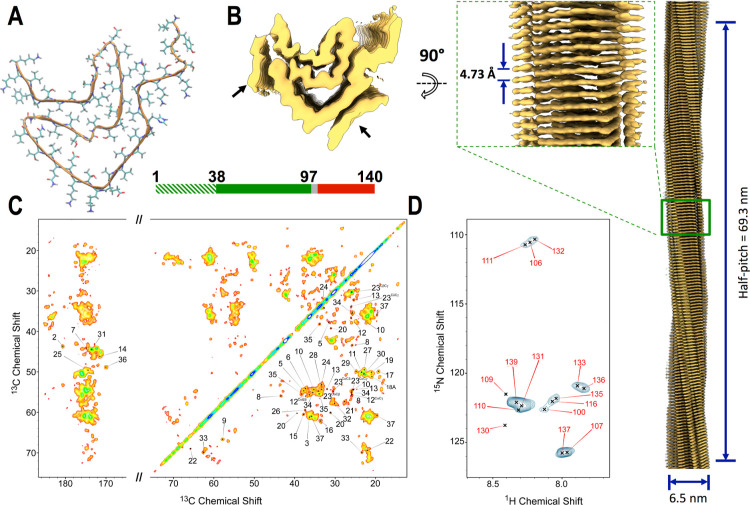
Structure of non-toxic late-fibrils from αS condensates. (A) Cryo-EM structure of late-fibrils resolved at 3.3 Å (PDB code: 8RI9). The structure, which is composed of one protein molecule in each stack of the fibril, is shown in the direction of the fibril axis. The atomic model, which spans residues 38 to 97, has a similar amyloid topology of αS fibrils studied postmortem from JOS patients29 (Figure S11). (B) 3D density from the cryo-EM analysis shown from the top (left) and side (right) views (EMD code: 19184). Lower resolution density, indicated with black arrows, was not amenable for model building (Figure S10). The map was resolved with a half pitch of 69.3 nm. The average diameter of the fibrils is 6.3 nm. (C) MAS ssNMR 13C–13C DARR spectra (aliphatic and carbonyl regions) measured using a 20 ms mixing time probed rigid regions in the core of the late-fibrils. The spectra included peaks from the N-terminal region (labeled in the spectra), indicating that these are rigid and structured in the late-fibrils. In order to improve the peak shape, these spectra were measured using αS fibrils obtained by incubating fresh monomers with seeds generated from the late-fibrils by sonication. Unseeded spectra are shown in Figure S15. (D) MAS ssNMR 1H–15N-HSQC spectra probed the dynamical regions of the late-fibrils. MAS ssNMR spectra were recorded at 5 °C at a MAS rate of 12.5 kHz.

