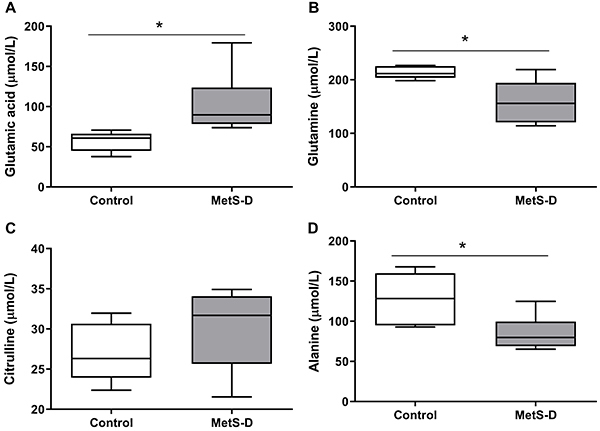
Figure 2. Amino acid serum concentration in diabetic-metabolic syndrome (MetS-D) and control animals. A, glutamic acid (µmol/L); B, glutamine (µmol/L); C, citrulline (µmol/L); and D, alanine (µmol/L). Data are representative of day 14 of the experiment. Data are reported as median and interquartile range (Q1-Q3) (n=6-7). *P<0.05, control group vs MetS-D group. Student's t-test was used for analysis of glutamine, citrulline, and alanine; Mann-Whitney test was used for glutamic acid.

