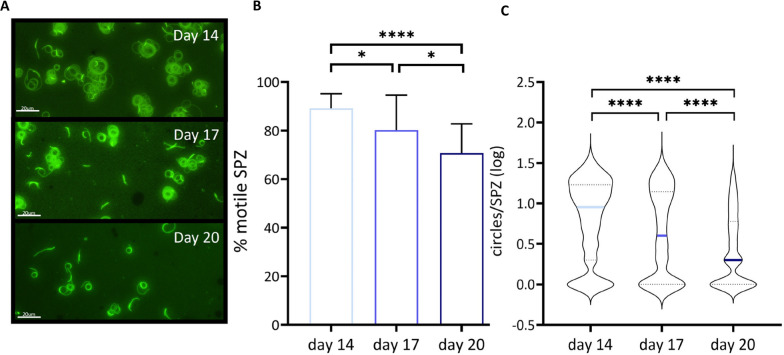
Fig. 3.
SPZ motility by immunofluorescent staining of tracks. A Representative image of SPZ tracks obtained from SPZ harvested at day 14, day 17 and day 20 post blood meal. B Percentage (%) of moving SPZ and stationary SPZ at day 14 (light blue), day 17 (blue) and day 20 (dark blue). C Distance travelled by motile SPZ determined by counting circles, n = 3 with day 14 (light blue) 794 SPZ tracks, day 17 (blue) 469 SPZ tracks and day 20 (dark blue) 775 SPZ tracks. Analysis using Mann Whitney U test. *p ≤ 0.05, **p ≤ 0.005, ***p ≤ 0.0005 and ****p ≤ 0.0001

