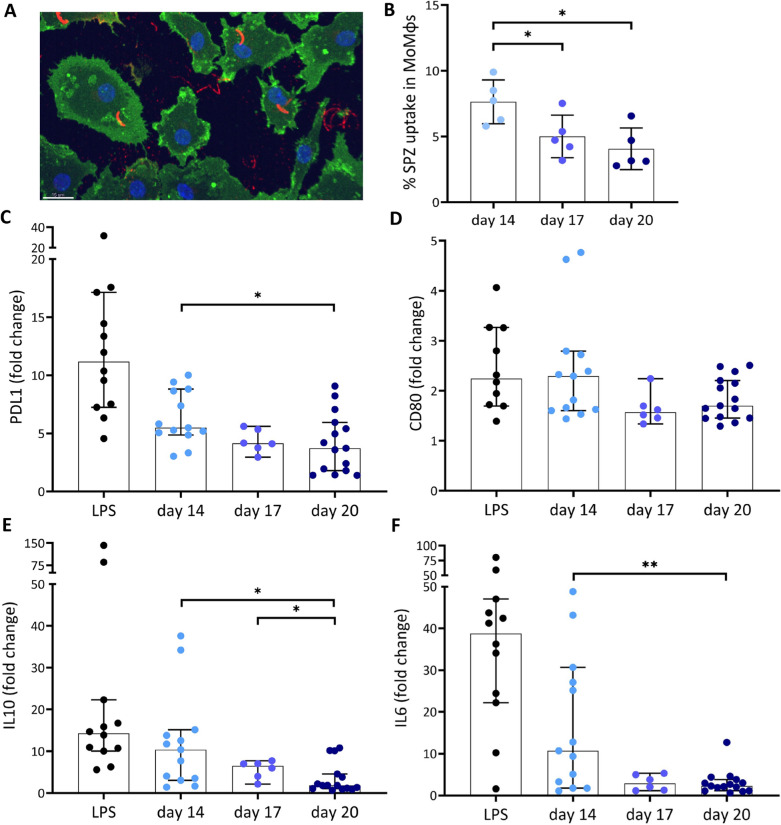
Fig. 6.
Immune response. A Confocal microscopy image of SPZ uptake by MoMɸs. MoMɸs membrane in green, nucleus in blue and SPZ in red. B Percentage of P. falciparum SPZ uptake by MoMɸs of day 14 (light blue), day 17 (blue) and day 20 (dark blue) SPZ. C Expression of PD-L1 after stimulation with lipopolysaccharide (LPS) as a positive control (grey), and SPZ used at 14 days (light blue), 17 days (blue) and 20 days (dark blue) post blood meal. Data shown as median fluorescence intensity (MFI) fold change relative to medium stimulated control. D Expression of CD80 after stimulation with lipopolysaccharide (LPS) as a positive control (black), and SPZ at 14 days (light blue), 17 days (blue) and 20 days (dark blue) post blood meal. Data shown as median fluorescence intensity (MFI) fold change relative to medium stimulated control. E Production of IL-6 by MoMɸs after 24 h in pg/mL, fold change relative to medium stimulated control. F production of IL-10 by MoMɸs after 24 h. Day 14 N = 13, Day 17 N = 6, Day 20 N = 15. Analysis using Mann Whitney U test. *p ≤ 0.05, **p ≤ 0.005, ***p ≤ 0.0005 and ****p ≤ 0.0001

