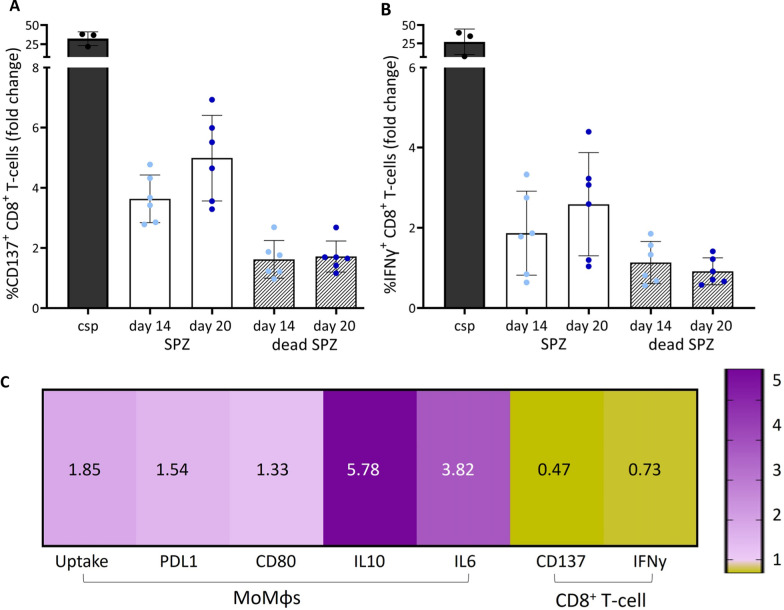
Fig. 7.
CD8+ T-cell response and immunogenicity. A Percentage of CD137+ CD8+ T-cells. CSP (black), day 14 SPZ (light blue), day 20 SPZ (dark blue), day 14 and 20 dead SPZ (grey striped bar). Data shown as fold change relative to medium stimulated control. B Percentage of IFNγ+ CD8+ T-cells. C Ratio of day 14 divided by day 20. In purple ratio score above 1, day 14 SPZ show an increased pattern compared with day 20 SPZ. In yellow ratio score below 1, day 14 SPZ show a decreased pattern compared with day 20 SPZ. Calculated for MoMɸs experiments: uptake, expression of PDL1 and CD80 and cytokine production of IL10 and IL6, and for CD8+ T-cell co-culture activation markers CD137 and IFNγ. Analysis using Mann Whitney U test. *p ≤ 0.05, **p ≤ 0.005, ***p ≤ 0.0005 and ****p ≤ 0.0001

