Fig. 2.
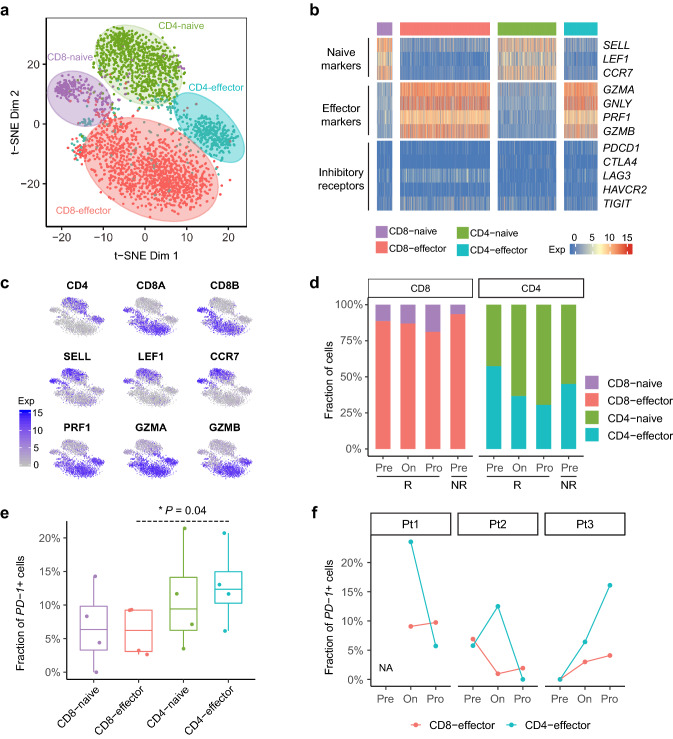
T cell subtype analysis based on single-cell gene expression. a The t-SNE projection of 3,042 single T cells from four patients, showing the formation of 4 main clusters illustrated in different colors. Cluster C8-naive: naive CD8+ T cells; C8-effector: effector CD8+ T cells; CD4-naive: naive CD4+ T cells; CD4-effector: effector CD4+ T cells. b Heatmap of four T cell clusters with signatures genes, which included naive, cytotoxic and exhaustion markers. c Expression levels of the selected genes across 3,042 single T cells illustrated in t-SNE plots. Selected genes included CD4, CD8A, CD8B, SELL, LEF1, CCR7, PRF1, GZMA, GZMB. d The percentages of cells in different clusters at pre-treatment, on-treatment and progression. The Pre/On/Pro represent the time points of pre-treatment, on-treatment and progression. The R and NR represent the responder and the nonresponder, respectively. e The percentage of PD-1+ T cells in each T cell cluster. f The percentage of PD-1+ T cells at each time point in three responders

