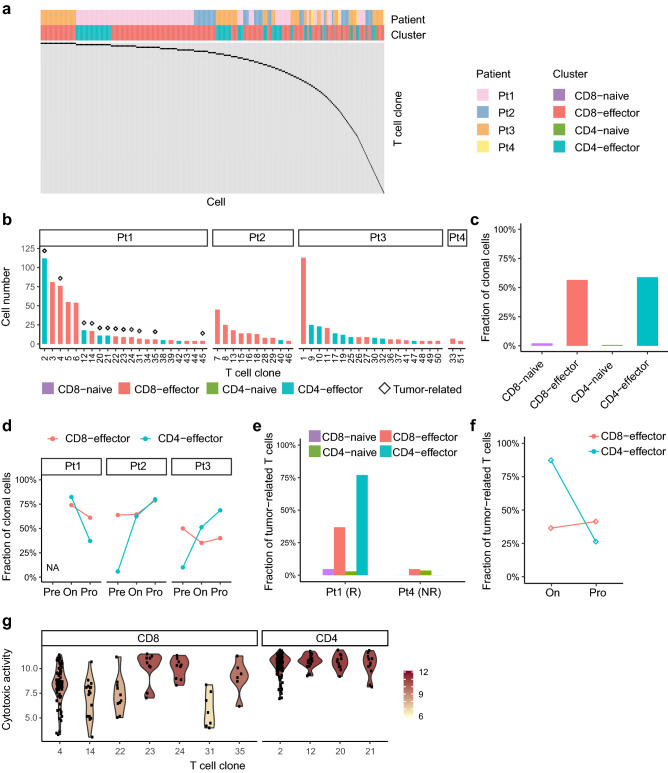
Fig. 3.
T cell clone analysis based on the TCR sequences. a TCR distribution of clonally-expanded T cells from four patients. Each column represents an individual cell, and each row represents a distinct T cell clone. b The cell numbers of expanded T cell clones. Only clones with ≥ 4 cells were showed. The diamond above the bar represents the tumor-related clone. c The percentage of clonal T cells in each T cell cluster. d The percentage of clonal T cells at each time point in three responders. e The percentage of tumor-related T cells in each cluster in responder Pt1 and nonresponder Pt4. f The percentages of tumor-related T cell in responder Pt1 at on-treatment and progression. g Violin plot showing the cytotoxic activity of tumor-related CD8+ and CD4+ T cell clones of Pt1. The cytotoxic activity was defined as the log-average (geometric mean) of expression of four cytotoxic genes, GZMA, GNLY, PRF1 and GZMB

