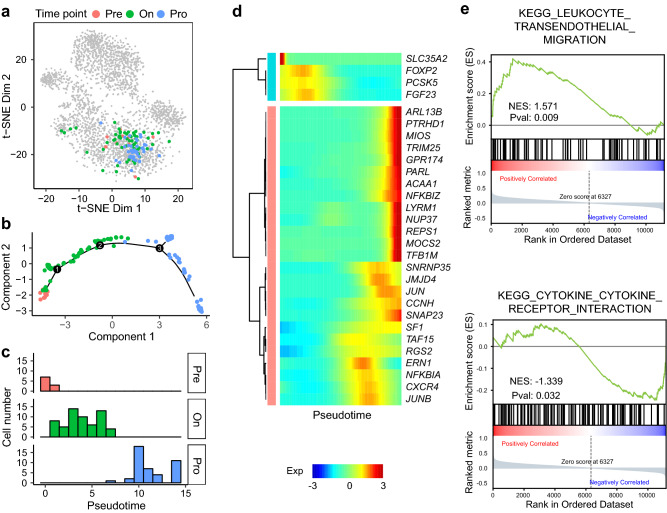
Fig. 5.
Trajectory analysis and related genes of CD8+ T cell clone TCR1. a Cells of the T cell clone TCR1 illustrated in t-SNE plot. b Pseudotime trajectory of the T cell clone TCR1 by Monocle. c Distribution of cells from different time points in pseudotime inferred by trajectory analysis. d Expression level of pseudotime-dependent genes. e Gene set enrichment analysis showing that cells of the T cell clone TCR1 exhibited higher activity in the “leukocyte transendothelial migration” pathway and lower activity in the “cytokine and cytokine receptor interaction” pathway along the pseudotime

