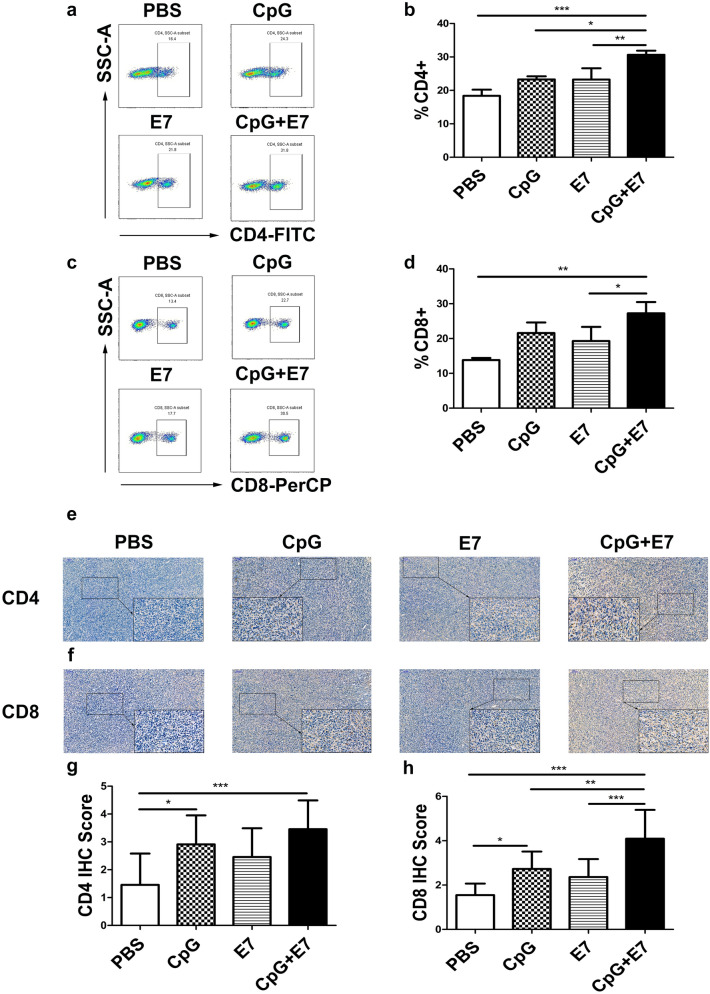
Fig. 2.
The effect of the vaccine on CD4 and CD8 cells in the TME. a–d The vaccine increased the number of infiltrating CD4 and CD8 T cells in the tumor. Representative flow cytometry scatter plots from one mouse (one out of three mice) showing tumor-infiltrating a CD4 and c CD8 T cells. Flow cytometry data showing tumor-infiltrating CD4 and CD8 T cells is represented as a bar graph expressed as b %CD4+ T cells and d %CD8+ T cells. The distribution of intratumoral e CD4 and f CD8 T cells was assessed by immunohistochemistry. The densities of g CD4 and h CD8 T cells in the vaccine group and CpG alone group were significantly higher than those in the control group. The data are depicted as the mean ± SD (n = 3). The significance of the data was evaluated by one-way ANOVA followed by Tukey’s multiple comparison test (*p < 0.05, **p < 0.01, ***p < 0.001)

