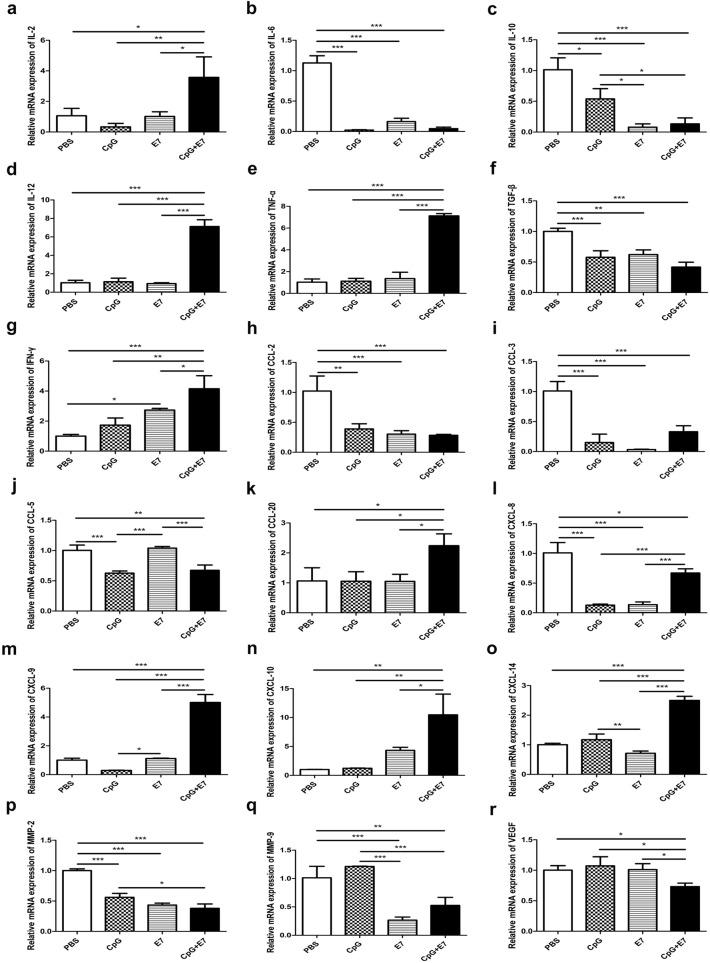
Fig. 4.
The relative expression of cytokines, chemokines and MMPs. The relative expression levels of a IL-2, b IL-6, c IL-10, d IL-12, e TNF-α, f TGF-β, g IFN-γ, h CCL-2, i CCL-3, j CCL-5, k CCL-20, l CXCL-8, m CXCL-9, n CXCL-10, o CXCL-14, p MMP-2, q MMP-9, and r VEGF in the tumor tissue are shown. All PCR data were calculated relative to β-actin and represent the average ± SD of triplicate samples. The significance of the data was evaluated by one-way ANOVA followed by Tukey’s multiple comparison test (*p < 0.05, **p < 0.01, ***p < 0.001)

