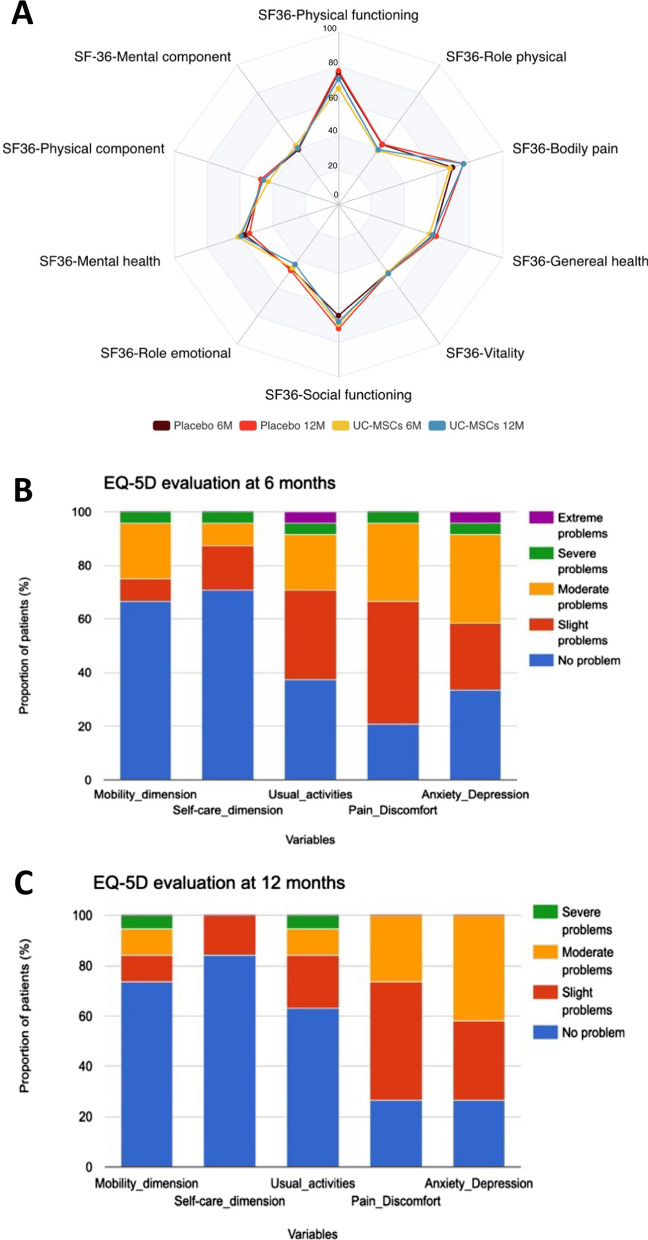
Fig. 2.
Comparative analysis of patient-reported outcomes using the medical outcome study 36-item short form survey and the EuroQol 5 dimension 5 level dimensions at 6 and 12 months. A UC-MSCs versus placebo groups are visualized as radar chart. Each of the eight domains is scored on a scale from 0 to 100, with a higher score indicating better health and less impact of health on usual roles. In this radar chart, the central point represents a score of 0, while the outermost boundary corresponds to a score of 100. B and C Bar chart representation depicting the EQ-5D variables at 6 months (B) and at 12 months (C). At the 6-month assessment, 11 patients from the UC-MSCs group and 13 from the placebo group were evaluated (24 patients in global cohort). At the 12-month mark, 7 patients from the UC-MSCs group and 12 from the placebo group were assessed (19 patients in global cohort). EQ-5D EuroQol 5 Dimension 5 Level. M month. UC-MSCs umbilical cord-derived mesenchymal stromal cells. SF-36 36-Item Short Form Survey

