Fig. 2.
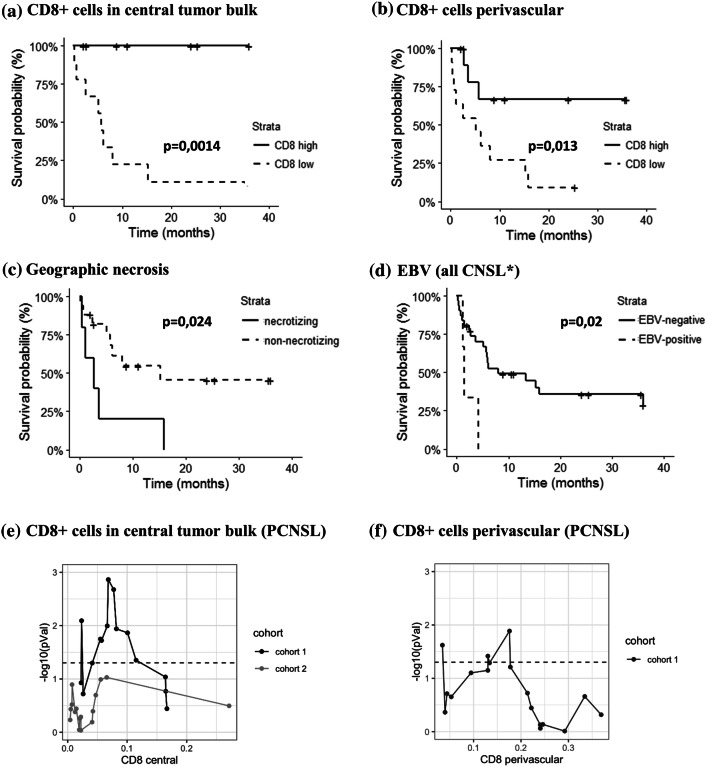
Survival analysis. Kaplan–Meier survival plots for groups with high versus low number of CD8+ cells in the perivascular (a) and the central (b) tumor bulk areas in PCNSL primary central nervous system lymphoma (PCNSL, n = 22). Kaplan–Meier survival plots based on the presence or absence of necrosis in PCNSL (c) and EBV for all CNSL (d) excluding autopsy diagnosed cases (n = 34); evolution of the Kaplan–Meier p value for all thresholds of CD8+ cells in central tumor bulk (e) and perivascular (f) in PCNSL. The survival score is the −log10 of the p value; the relative rank is the position of the threshold in the list of all tested thresholds; the dashed line is the threshold for significance. Cohort 2 (n = 17) is a validation cohort of small biopsies excluded from initial analysis. Abbreviations: NS, non-significant; S, significant

