Fig. 3.
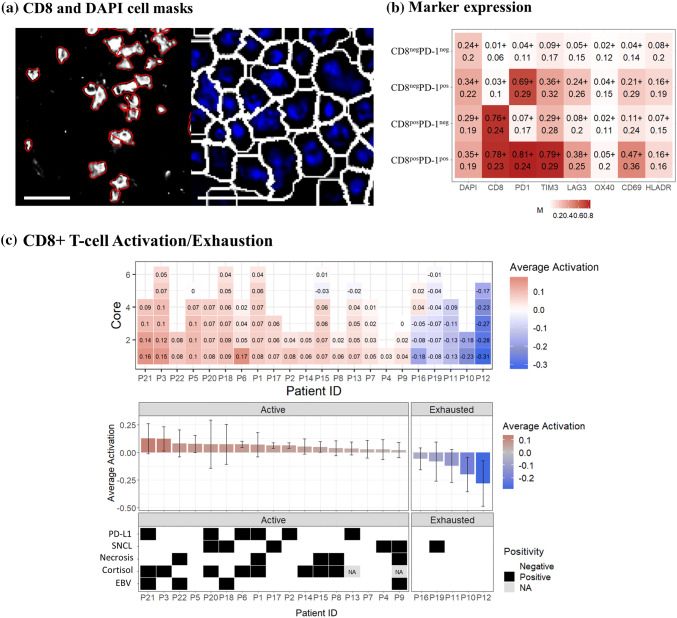
Multiplex analysis of cytotoxic T cells. a CD8+ object identification image (Cellprofiler) used for subsequent activation/exhaustion analysis with identified objects outlined in red. Right panel: DAPI-based object identification (white outline) used to calculate CD8 and PD-1 double positive cell populations (R statistical software). Scale bar = 20 μm; b selected marker expression in the identified cell populations. The numbers in each square represent the average expression over all cells (± the standard deviation) for DAPI, CD8, PD-1, TIM-3, LAG-3, OX40, CD69 and HLA-DR; c average T cell activation status for each TMA core (square) of each patient (column) ranked from most active (left) to most exhausted (right) overall T cell status; d average T cell activation for each patient and correlation of this activation status to the PD-L1 expression on malignant cells (PD-L1), primary versus secondary CNS lymphoma (SNCL), presence or absence of geographic necrosis (Necr.) and relation to EBV (EBV), respectively

