Fig. 4.
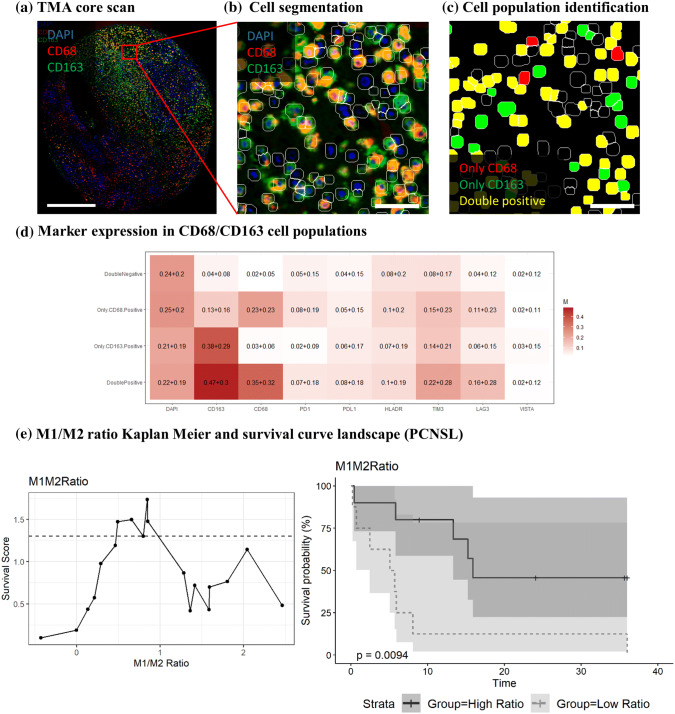
Multiplex analysis of macrophages. a Processed immunofluorescence image of DAPI (blue), CD68 (red) and CD163 (green) used for subsequent analysis. Scale bar = 500 μm; b cell segmentation: magnification from TMA core region in (a) with additional DAPI cell segmentation mask (white outline). Scale bar = 50 μm; c cell population classification: CD68 only (red), CD163 only (green), CD68/CD163 double positive (yellow) and double negative (black). Scale bar = 50 μm; d selected marker expression in the identified cell populations. The numbers in each square represent the average expression over all cells (± the standard deviation) for DAPI CD163, CD68 PD-1, PD-L1, HLA-DR, TIM-3, LAG-3 and VISTA). The numbers in each square represent the average expression over all cells (± the standard deviation); e Kaplan–Meier survival curve (right) based upon the most significant ratio threshold (left). The survival score is the –log10 of the p value, and the x-axis contains the different possible M1/M2 ratios (left). The dashed line represents the threshold for significance. Abbreviations: NS, non-significant; S, significant

