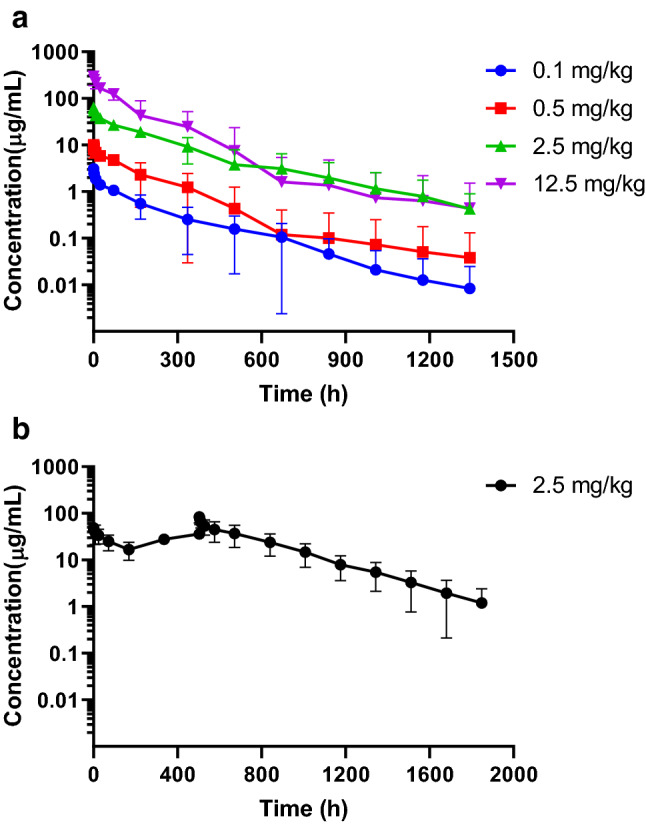
Fig. 5.

PK profile of IBI101 in cynomolgus monkeys. a Drug concentration time curves of cynomolgus monkeys after a single i.v. administration of IBI101 at low, middle, sub-high and high dosages (n = 6). b Drug concentration–time curves of cynomolgus monkeys after successive i.v. administrations of 2.5 mg/kg IBI101 (n = 6)
