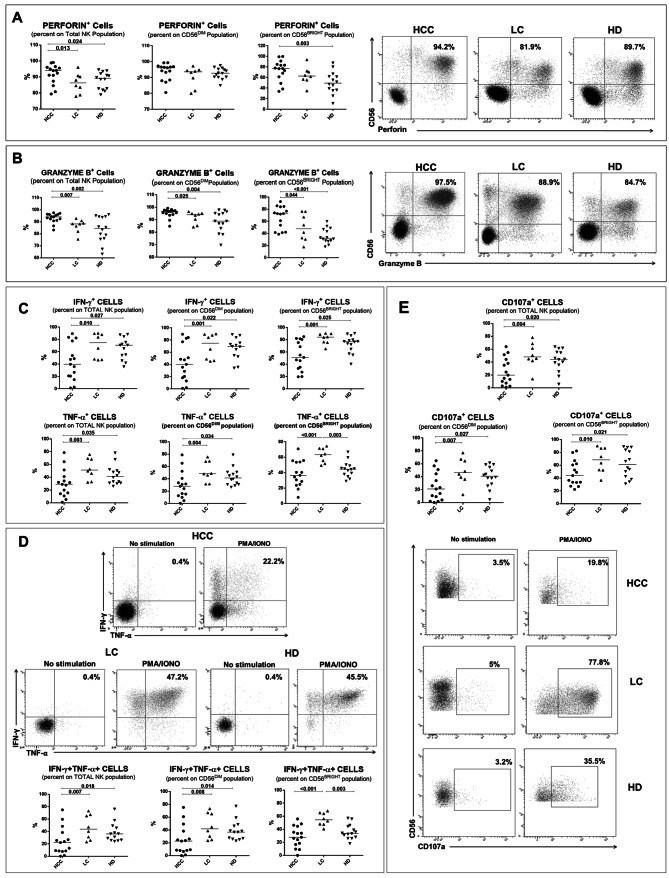
Fig. 3.
Expression of molecules associated with cytotoxic response in NK-cells and NK-cell functional analysis. a, b Left panels: percentage of Perforin + (a) and Granzyme B + (b) in NK-cell subsets from HCC, LC and HD. Right panels: representative dot plots of Perforin (a) and Granzyme B (b) staining in HCC, LC and HD. C. IFN-γ and TNF-α production was evaluated with or without PMA (phorbol 12-myristate 13-acetate) (50 ng/ml) and ionomycin (1 μg/ml) for 4 h, in NK-cell subsets. After addition of monensin (10 μg/ml), cytokine determinations were performed by intracellular cytokine staining (ICS). d Upper panels: representative dot plots of IFN-γ and TNF-α staining upon stimulation with PMA/Ionomycin in HCC, LC and HD. Lower panels: frequency of polyfunctional IFN-γ+TNF-α+ NK-cells in HCC, LC and HD. e The cytotoxic potential of NK-cells evaluated by the CD107a degranulation assay. After stimulation with PMA and ionomycin, cells were incubated with anti-CD107a, as in c. Upper panels: percentage of CD107a+ cells in NK-cell subsets from HCC, LC and HD. Lower panels: Representative dot plots showing CD107a expression in NK-cells from HCC, LC and HD upon PMA/Ionomycin stimulation. c–e Data are expressed as the difference between the percentage of cytokine+ or CD107a+ NK-cells in the stimulated and unstimulated samples. Horizontal lines represent median values. Differences between multiple groups were evaluated by the Kruskal–Wallis test; p values were corrected for pairwise multiple comparisons by the Dunn’s test

