Fig. 4.
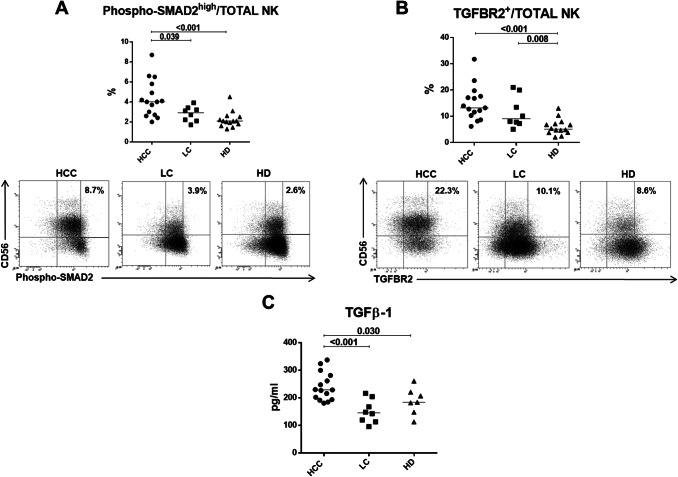
SMAD2 activation, TGF-βR2 expression and TGF-β plasma levels. a Upper panel: percentage of carboxy-termini (Ser465/467)-phosphorylated SMAD2 positive NK-cells from HCC, LC and HD. Lower panels: representative flow cytometry dot plots showing Phospho-SMAD2high analysis in study groups. b Upper panel: percentage of NK-cells expressing TGF-βR2 in HCC, LC and HD and Lower panels: representative dot plots of TGF-βR2 staining in HCC, LC and HD. c TGF-β plasma levels in HCC (n. 15), LC (n. 8) and HD (n. 7). Horizontal lines represent median values. Differences between multiple groups were evaluated by the Kruskal–Wallis test; p values were corrected for pairwise multiple comparisons by the Dunn’s test

